Live Monitor
The RIWA Gen-2 Live Monitor is a desktop application that lets you monitor the RIWA adaptive welding system in real time. This tool is designed for live monitoring during an active weld process.
The Live Monitor is not intended for browsing and reviewing past data.
Overview of Sections
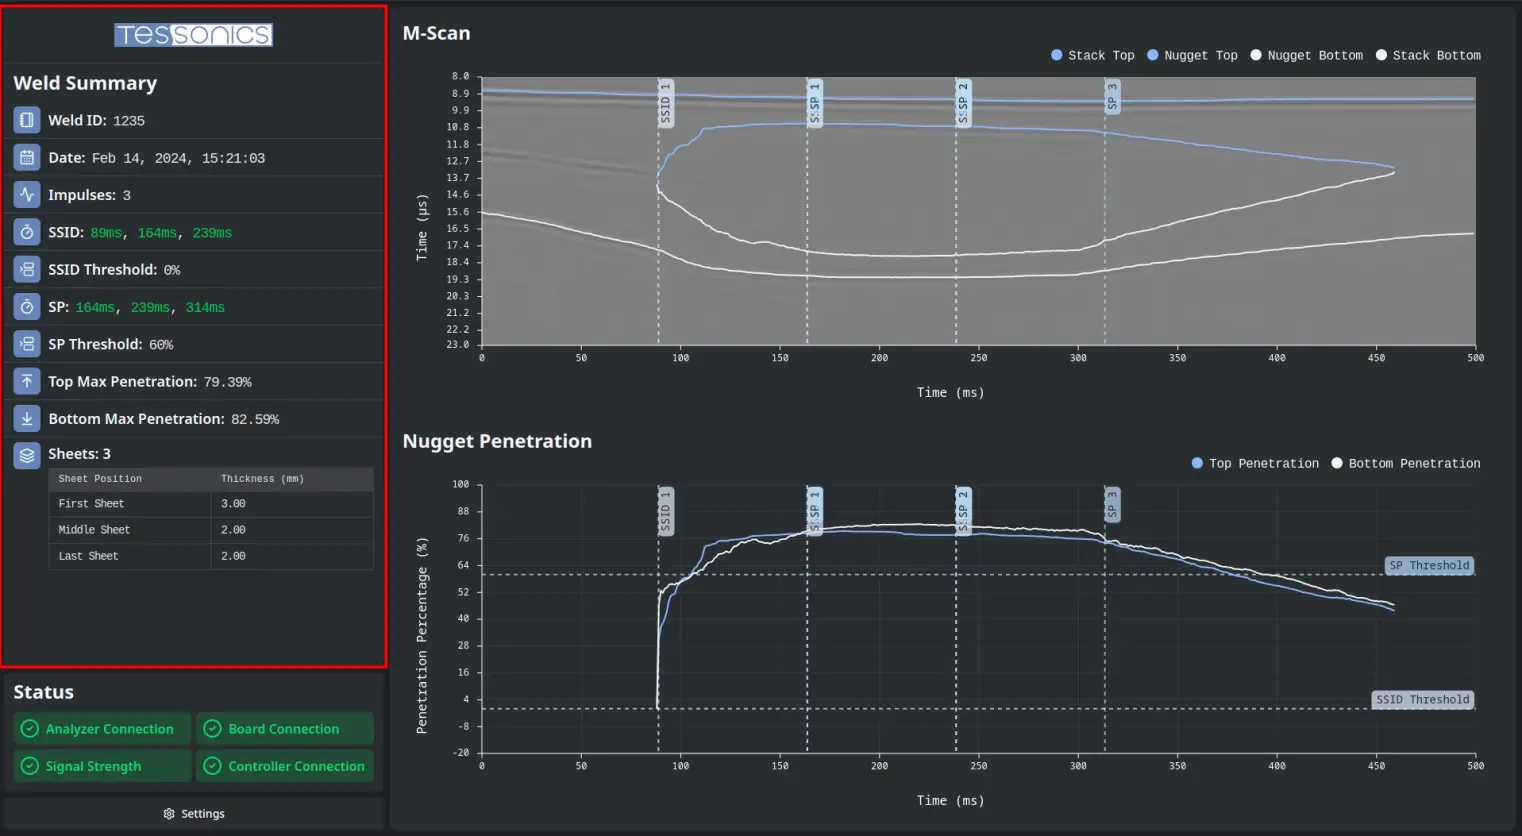
Weld Summary
The Weld Summary section displays a quick snapshot of the current weld's configuration and details.
Key weld details include:
- Weld ID;
- Date and time of the weld;
- Number of impulses;
- Sheet thickness; and more.
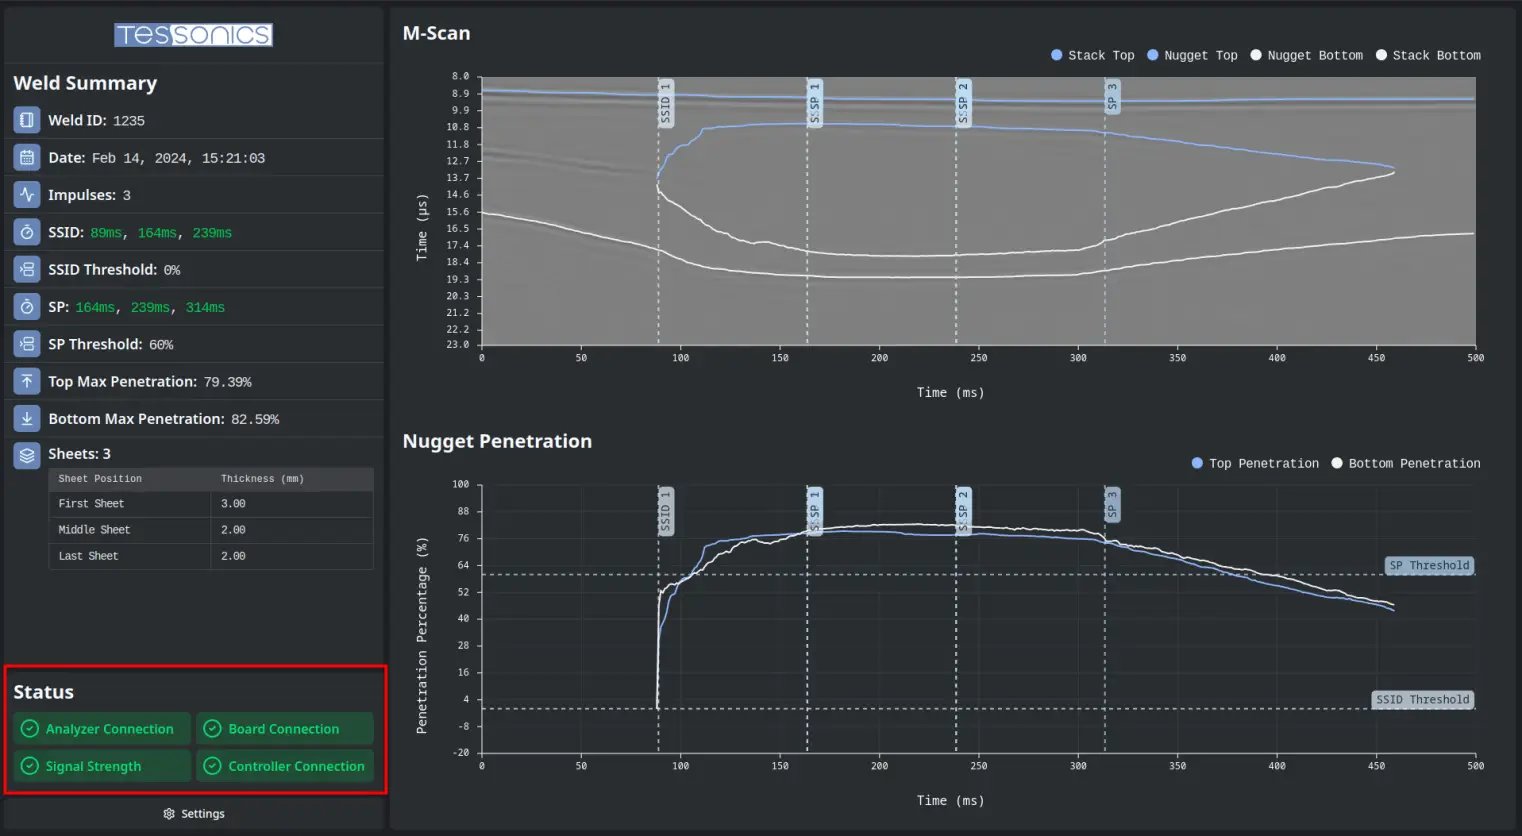
System Status
The System Status section displays the status of key components of the system.
This includes:
- Analyzer Connection (required for other statuses);
- Board Connection;
- Signal Strength; and
- Controller Connection.
The analyzer must be connected first for the other statuses to appear, as their statuses are reported by the analyzer.
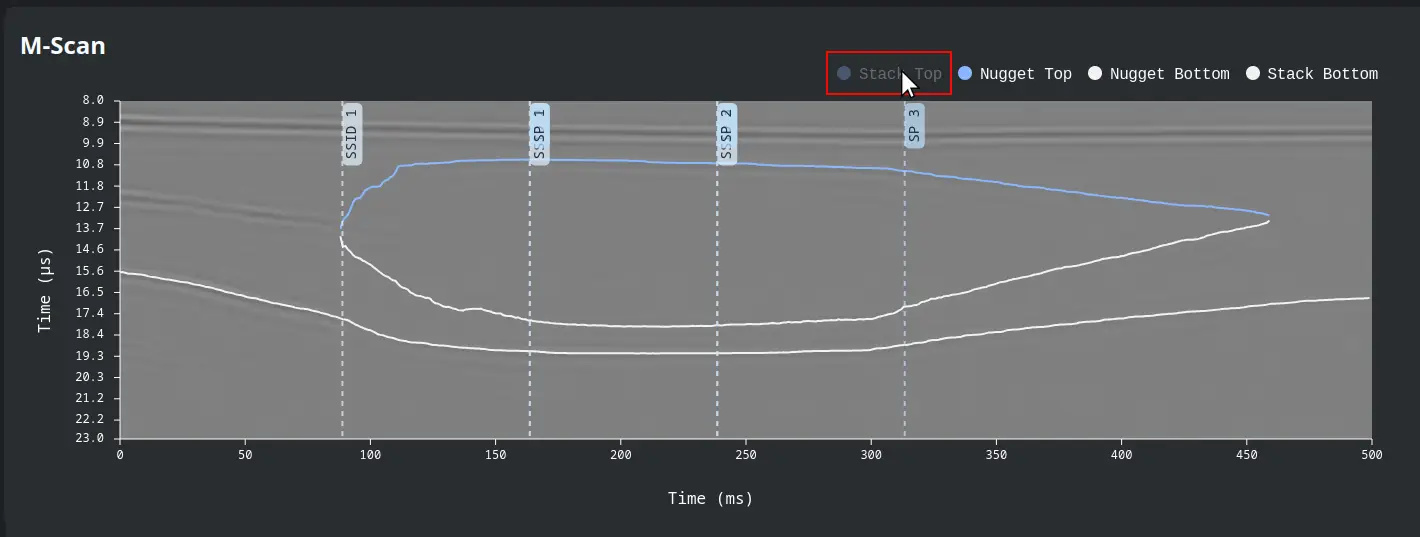
M-Scan
The M-Scan section displays the M-Scan, which provides a visual timeline of the weld.
- Overlaid on the image are interface lines that highlight:
- Stack Top;
- Nugget Top;
- Nugget Bottom; and
- Stack Bottom.
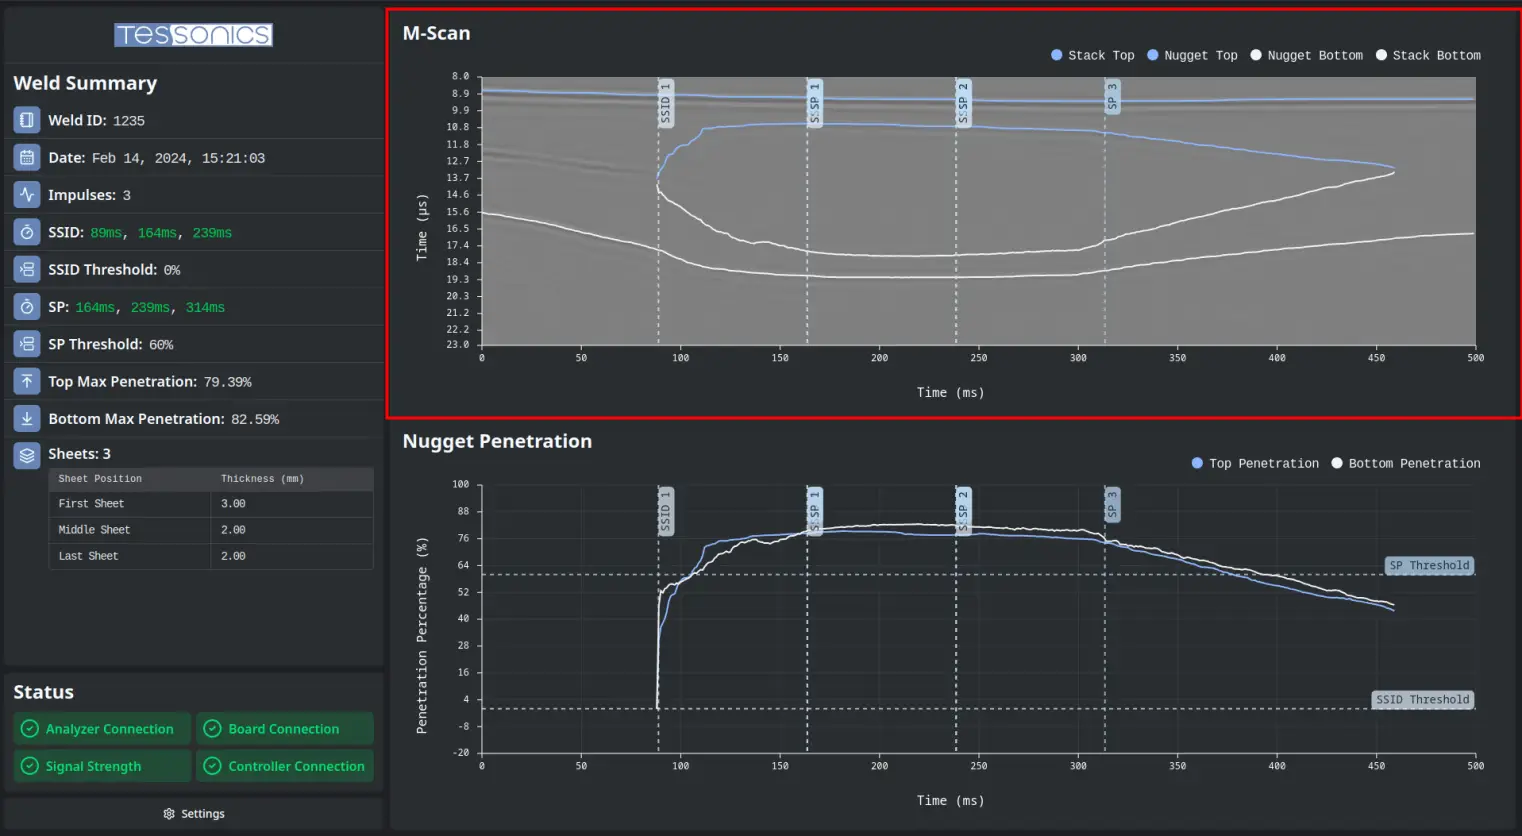
These annotations can be toggled on and off by clicking their entries in the legend. For example, clicking Stack Top will toggle its visibility.
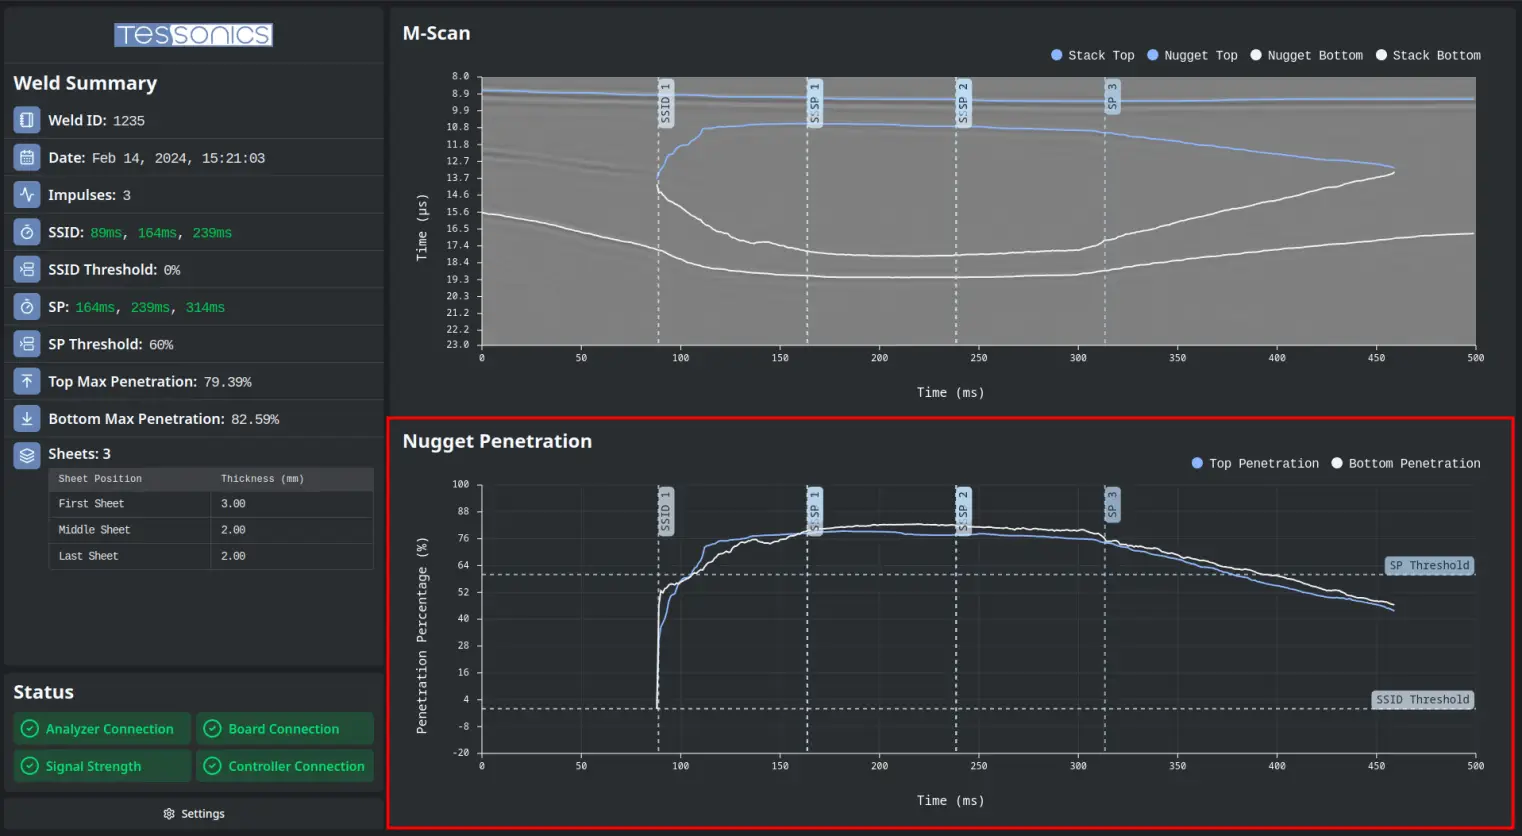
Nugget Penetration Graph
This graph tracks penetration percentages over time. The x-axis represents time (ms) while the y-axis represents penetration (%). The following two lines are displayed on the graph:
- Top Penetration: Penetration of the top interface.
- Bottom Penetration: Penetration of the bottom interface.
These lines can be toggled on and off by clicking on their entries in the legend.
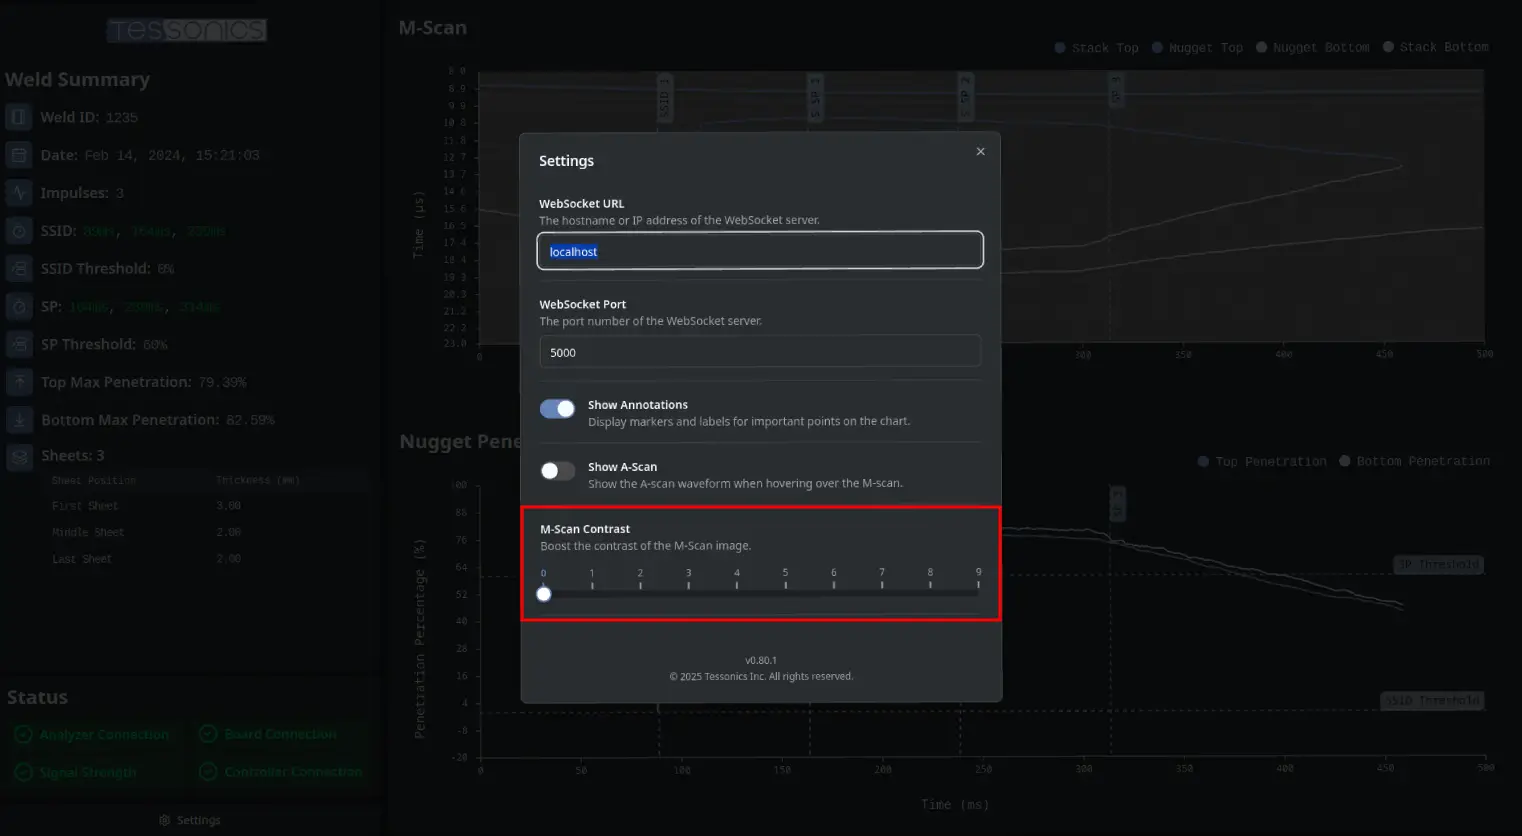
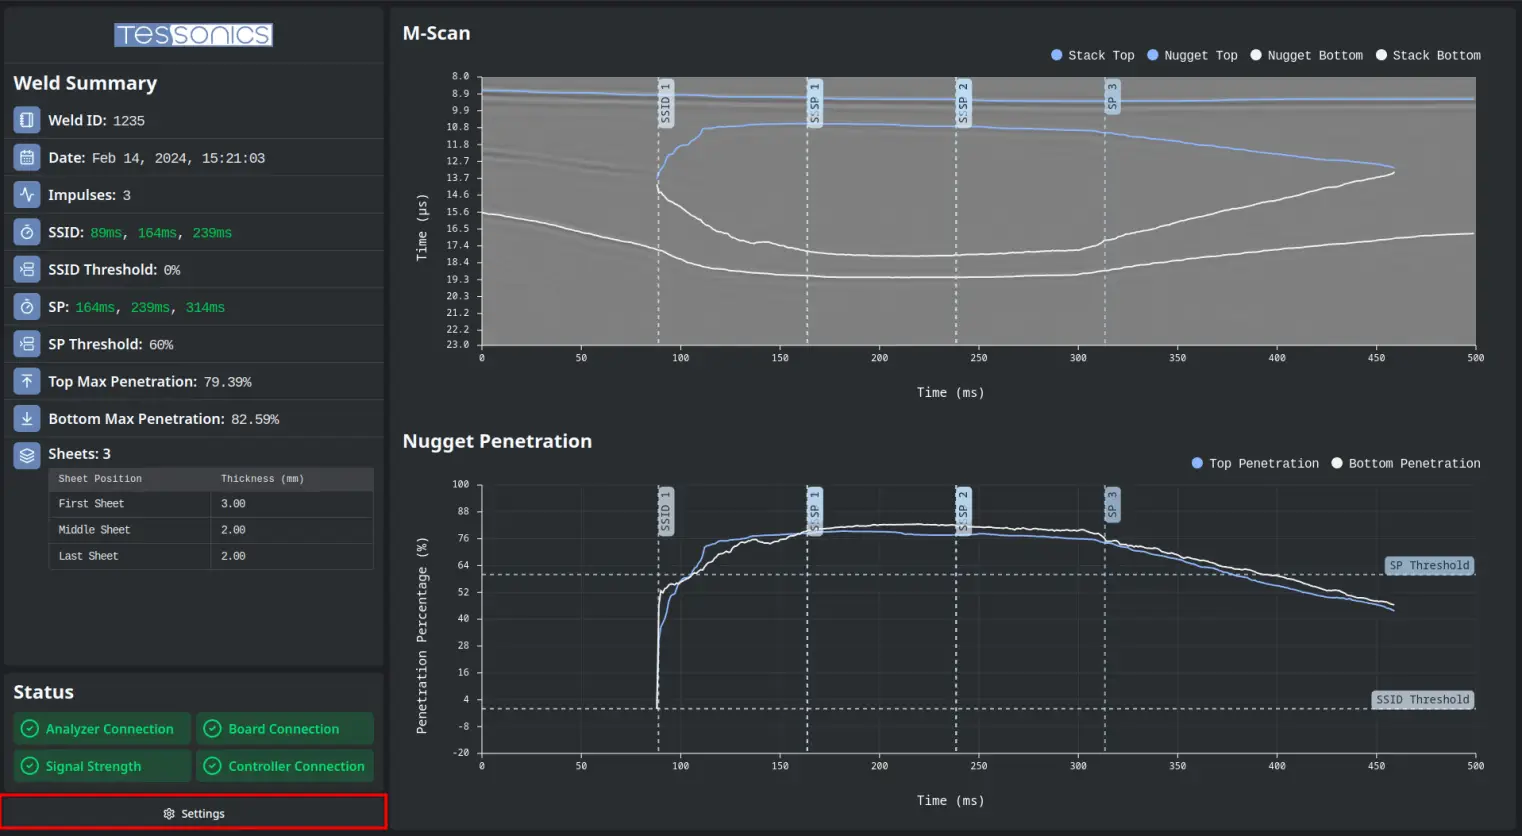
Settings
The Live Monitor can be configured by clicking the Settings button located at the bottom-right corner of the application window. This opens the settings dialog.
Connection Settings
To change the analyzer's WebSocket connection details, simply update the "WebSocket URL" and "WebSocket Port" fields and the Live Monitor will automatically attempt to reconnect using the new settings.
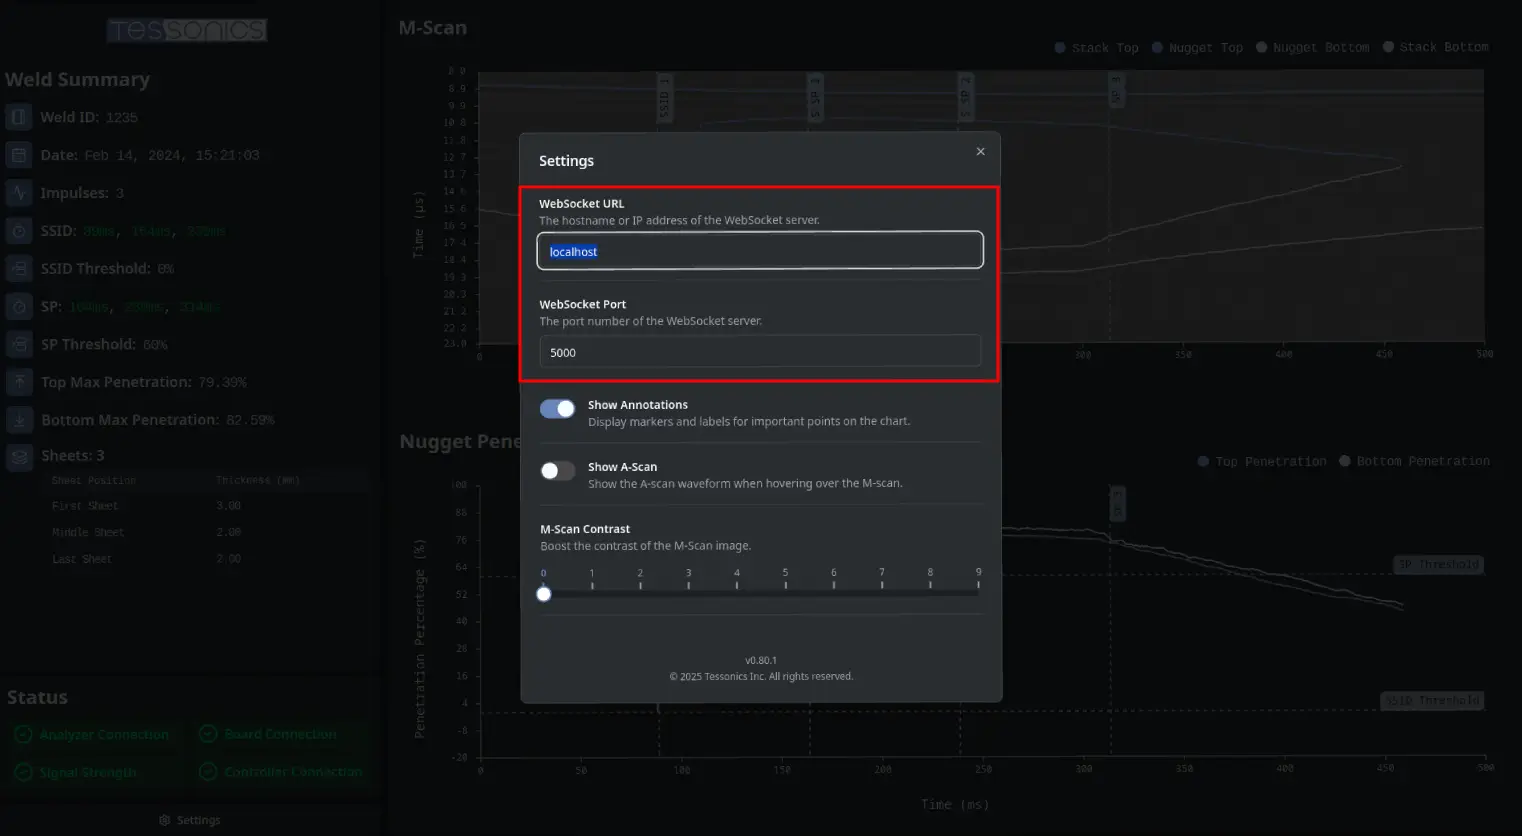
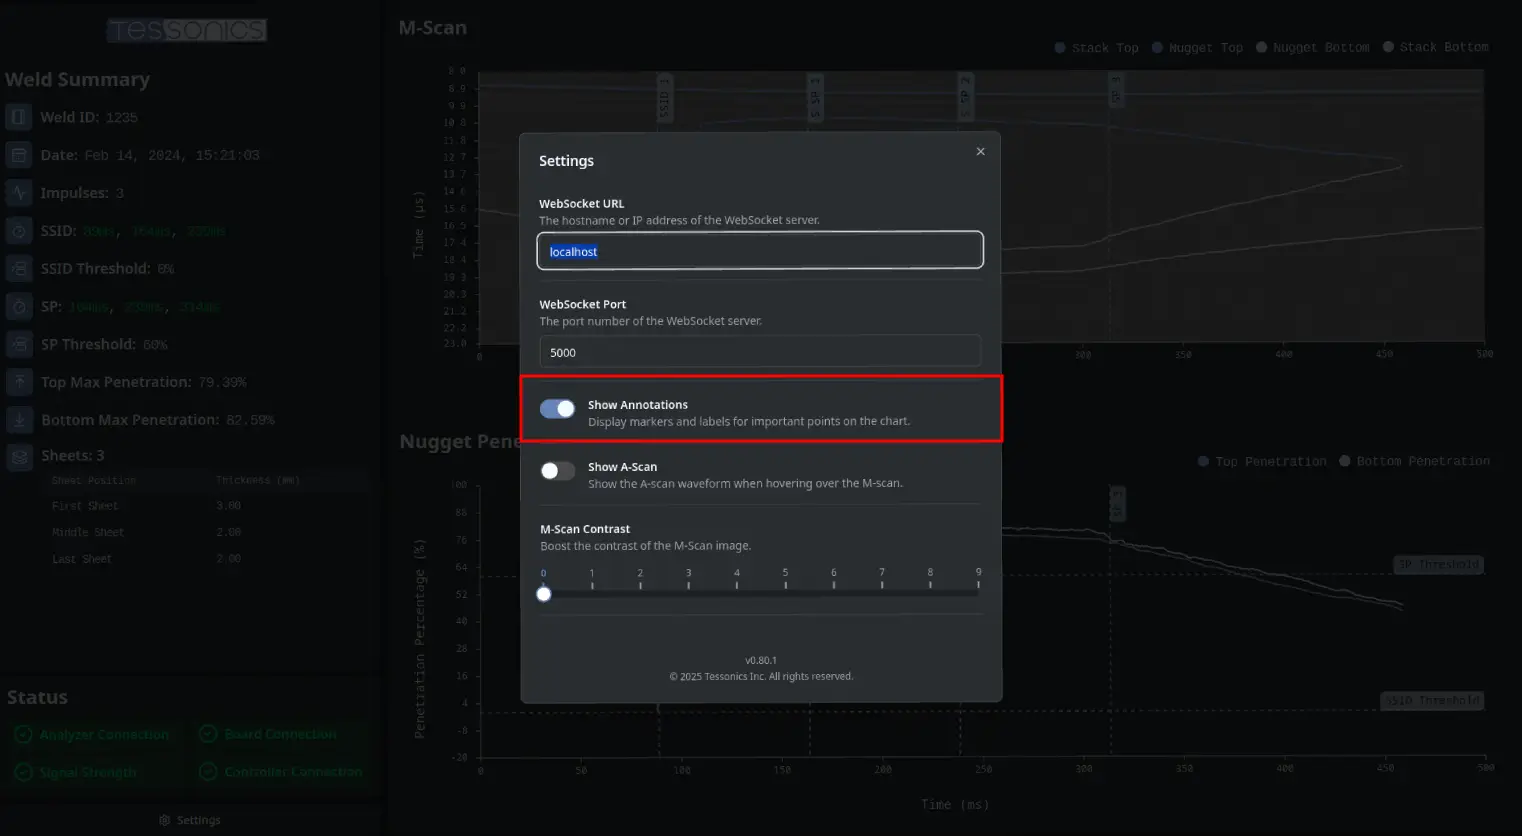
Annotation Settings
The Show Annotations option toggles the visibility of annotations on the M-Scan and Nugget Penetration Graph. These include the positions of SP and SSID, and thresholds in the Nugget Penetration graph.
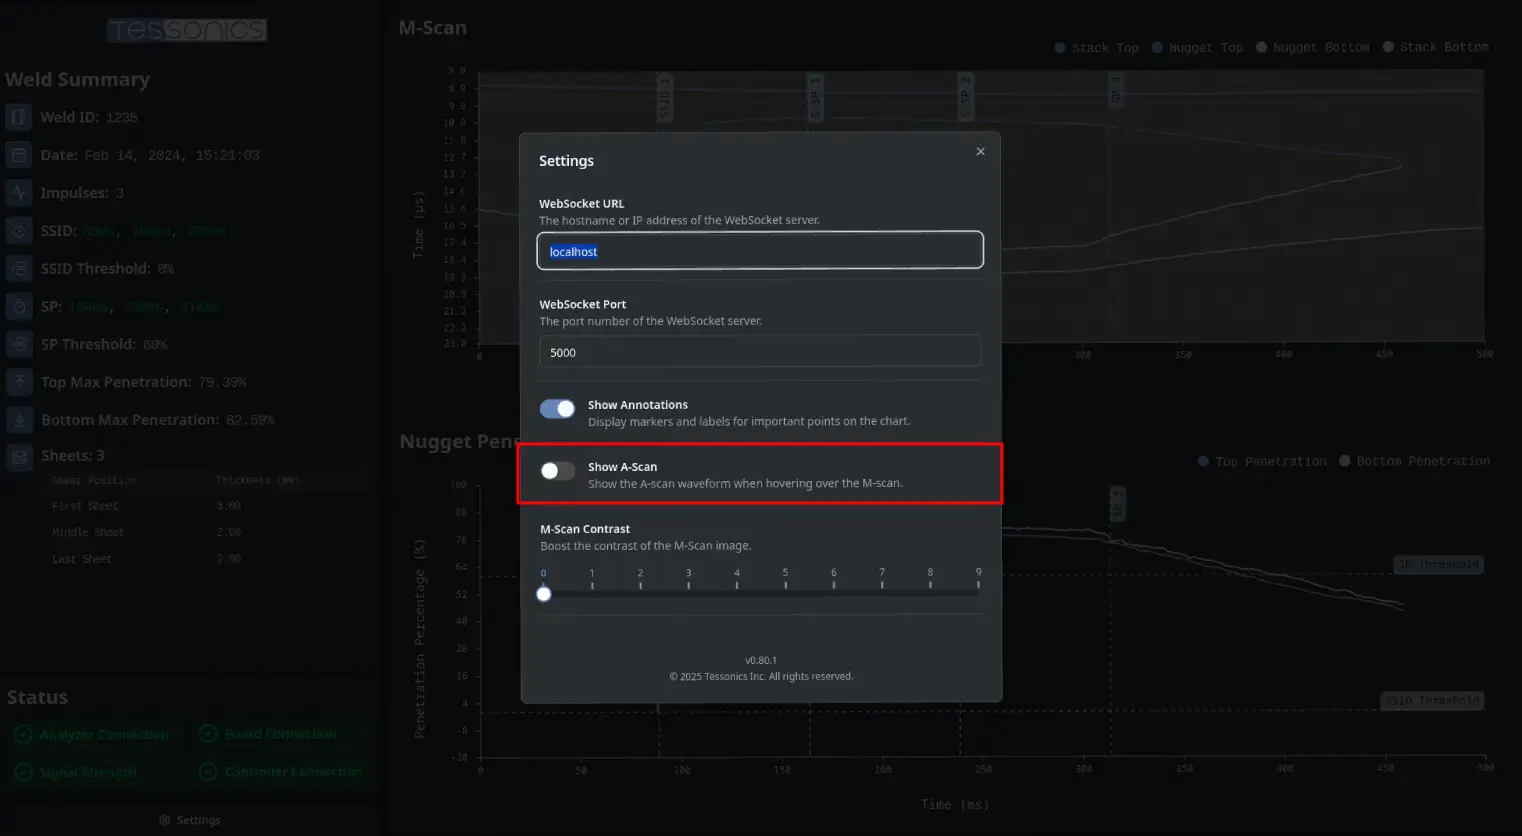
A-Scan Display
The Show A-Scan setting controls whether an A-Scan graph appears when the M-Scan is hovered over. This option is useful for analyzing specific regions of the M-Scan.

M-Scan Contrast
The M-Scan Contrast slider can be used to boost the contrast of the M-Scan image. This is useful for identifying finer details in the M-Scan.
- Range: 0 (no boost) to 10 (maximum boost).