Dashboard
Overview
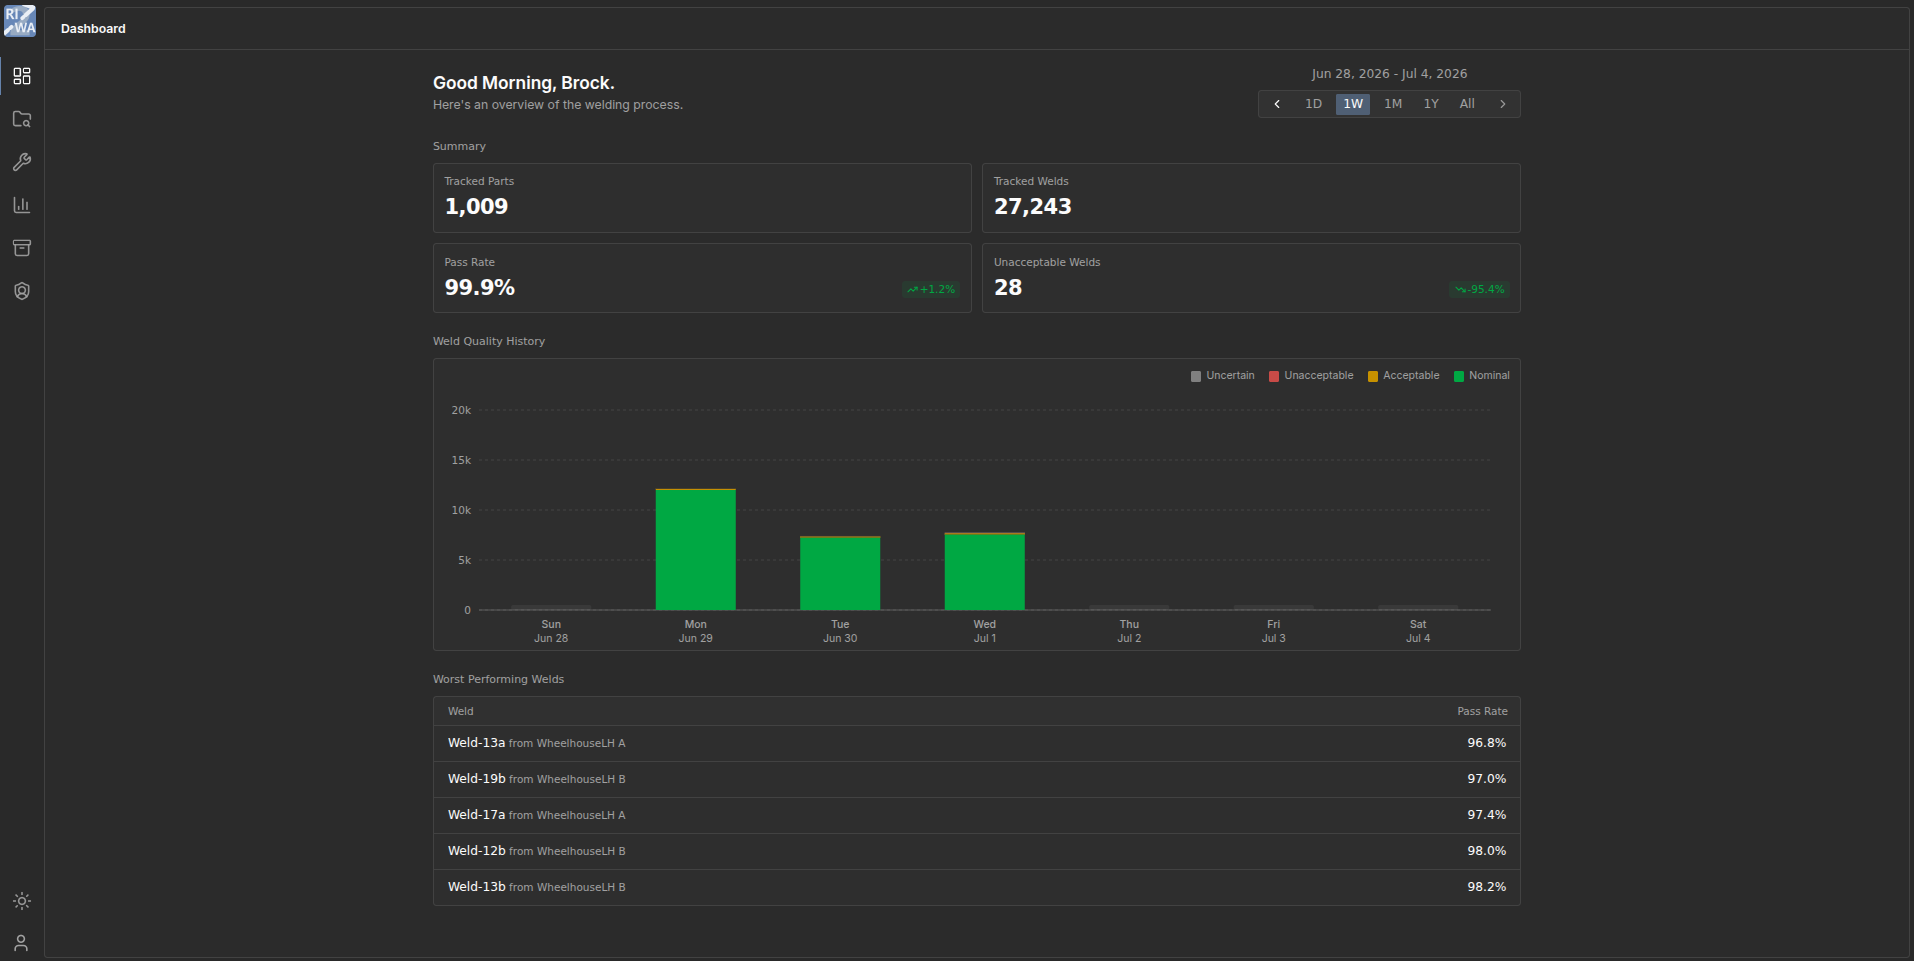
In the Dashboard section of the RIWA Hub, users can view a high-level overview of their production statistics. Key metrics include the total number of Tracked Parts, total Tracked Welds, current Pass Rate, and the number of Unacceptable Welds. By default, the Dashboard displays data from the past week, but the time range can be set to the following intervals relative to the current day:
1D: One day (12:00 AM to 11:59 PM)1W: One week (Sunday to Saturday)1M: One month (1st of the month to the end of the month)1Y: One year (1st of January to December 31st)All: All-time
If you wish to view a previous data range, for example the previous week's data exclusively, please refer to the Adjustable Time Ranges sub-section of this documentation.
The Dashboard also includes a Weld Quality History bar chart that displays daily weld quality. Each bar is colour-coded according to the corresponding weld quality rating, as indicated in the chart legend located in the top-right corner.
Below the chart, the Dashboard highlights the Worst Performing Welds, showing each weld along with its failure percentage to help identify areas requiring attention.
Badges
The Pass Rate and Unacceptable Welds metrics include performance badges that compare the selected time interval with the previous equivalent time interval. If the badge is green, it indicates their was an improvement in performance compared to the previous interval, whilst if the badge is red it will indicate there has been a decline in performance this interval.
Pass Rate Badges
Green (Improvement)

Red (Decline)

Unacceptable Welds Badges
Green (Improvement)

Red (Decline)

Adjustable Time Ranges
Along with the selectable time ranges are two buttons; < is used to go back one interval, while > is used to go forward one interval. Furthermore,
users can view their current time range above the selectable buttons.
Intervals will change depending on the selected time range. For example, if the time range is set to 1M, the < button will show users the previous months statistics, whilst the > button will show user the next months statistics.
In addition, users will not be able to view dates that have not already passed. For example, if a user is set to 1W and are looking at their current weeks analytics, they will not be able to press the > button.

Printing
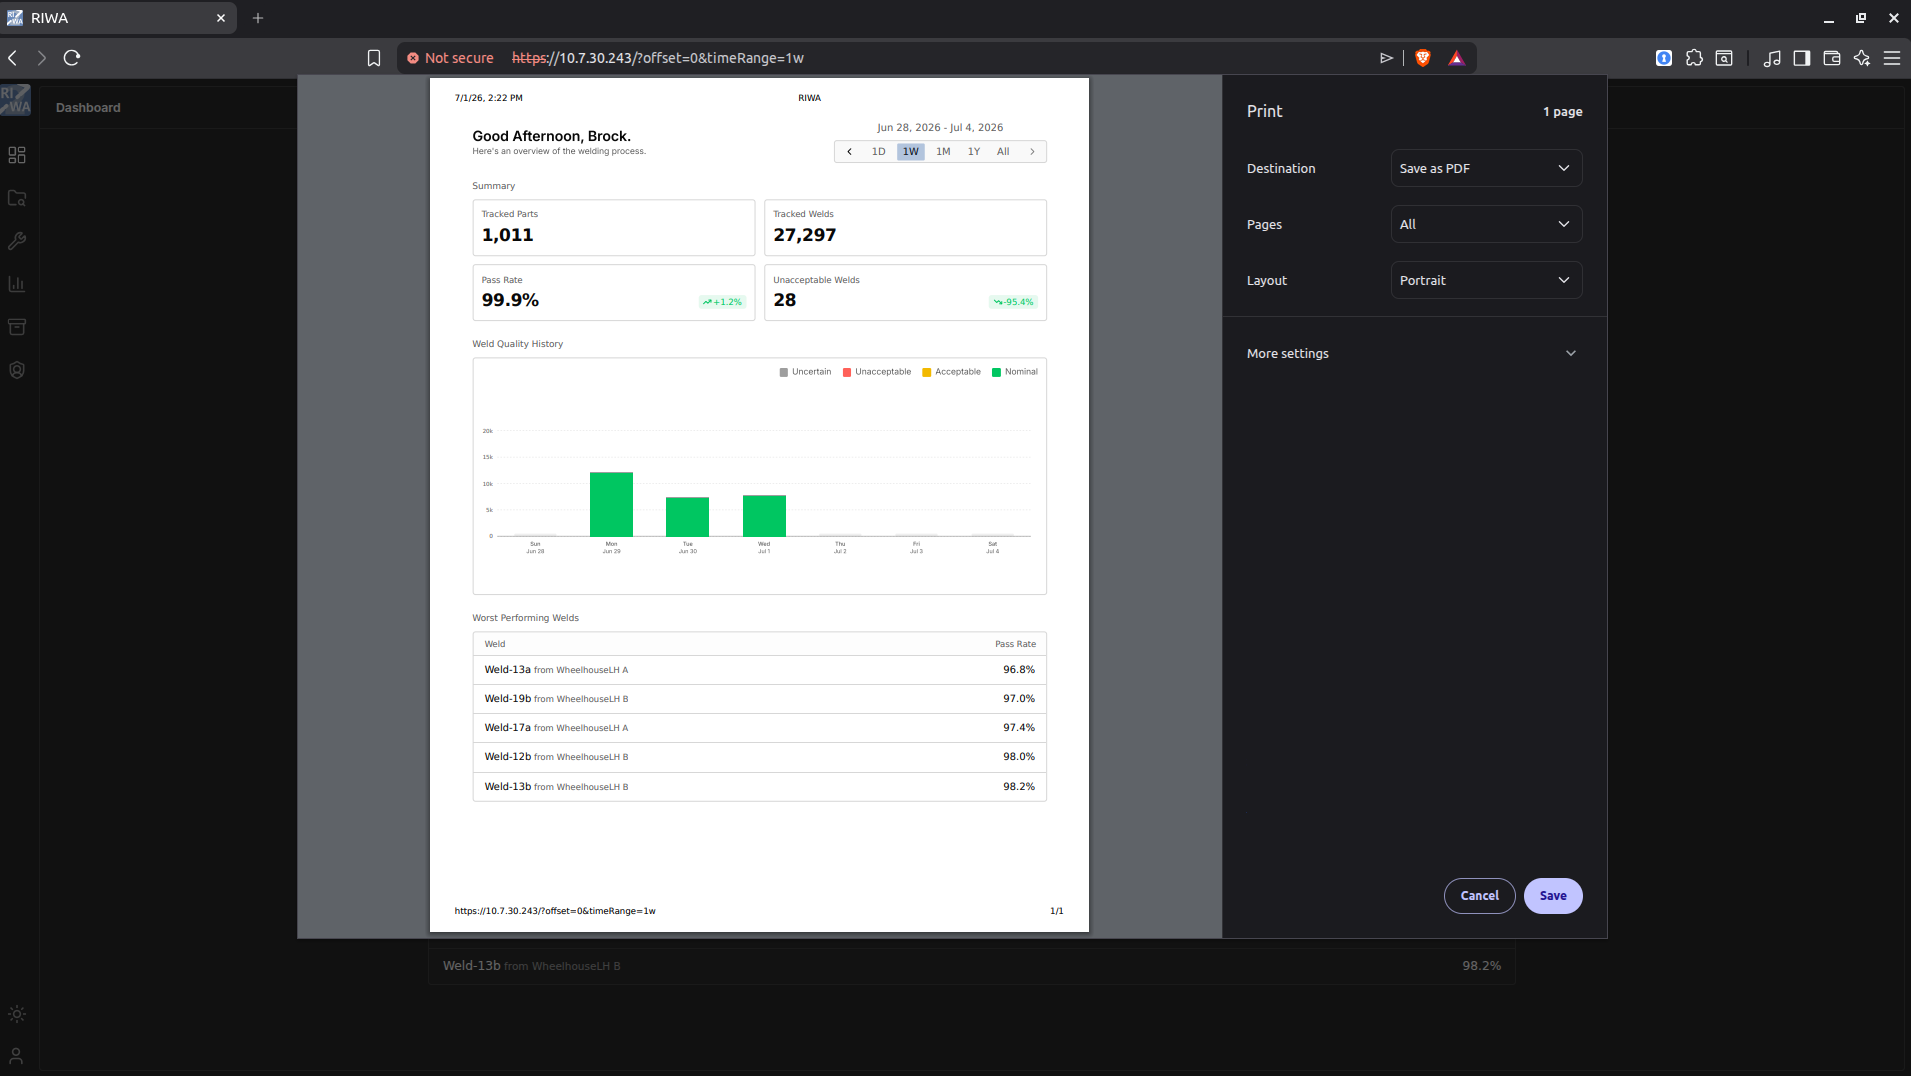
After a user selects their desired time range, they can press Ctrl+Pto open up their browsers print settings. From here, users can set their desired setting and print out and snapshot of their production statistics.