Correlation App
The Correlator App assists in finding the correct settings for the Tessonics RSWA to enable optimal measurement restults during non-destructive spotweld inspection.
In order to do this, the measurement results of non-destructive inspections are compared to those of destructive tests and evaluated. The algorithm settings are sorted and the best three are highlighted.
The Correlator App only serves as assistance; the final decision about the quality of a set of settings should be made after manual inspection.
Quickstart
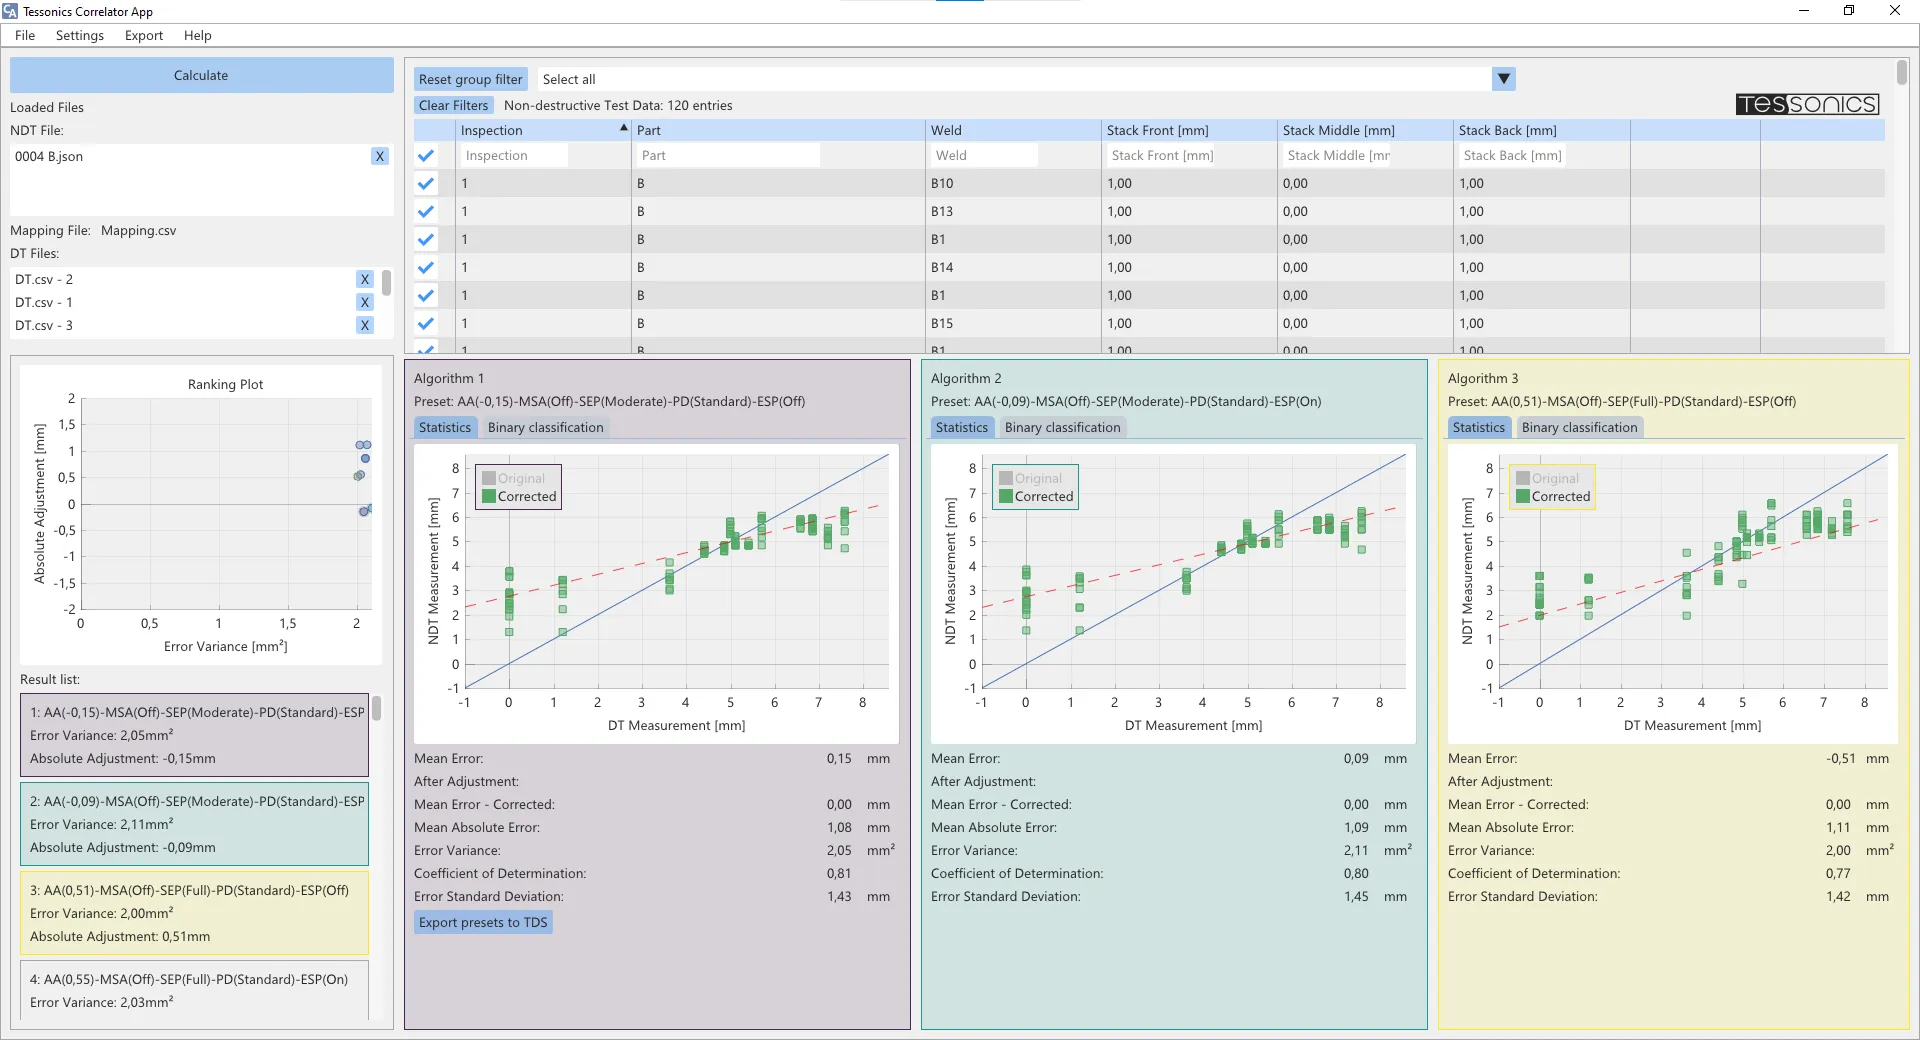
The image below shows the start screen of the Correlator App. The button File→Load Workspace allows to load a workspace that was saved previously.The Correlator App bundles a set of example files during installation that may optionally installed. By using Load Workspace these may be loaded directly.

During a standard installation, Windows will store the examples under C:\Program Files\Tessonics\CorrelatorApp\examples. With a user-defined installation path, this might differ.
Upon loading the example worksapce, the contained data sets will be displayed on the left on the list of read files. With a click on Calculate these data sets will be processed and the correlation is done. The output of that calculation is displayed in the images below.
User Interface
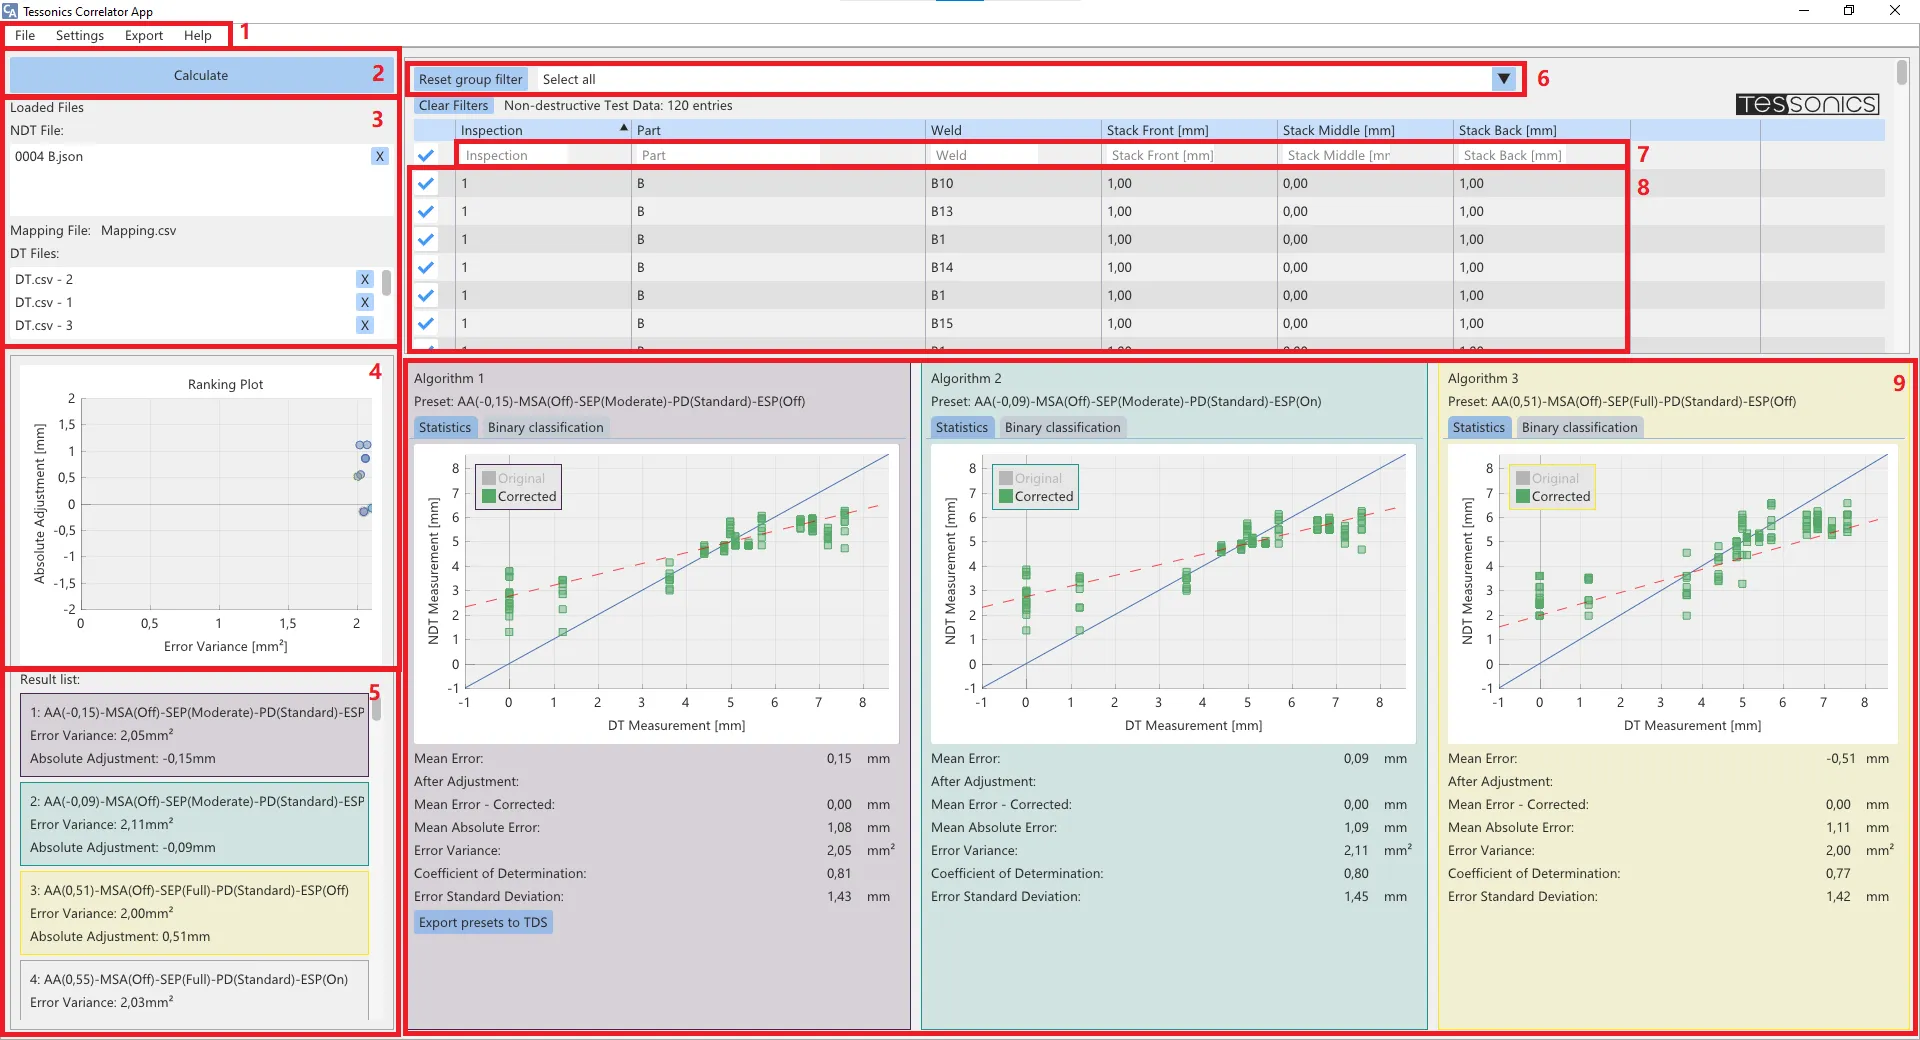
- Menu - The menu bar consists of multiple tabs. The tab File allows to load data sets, reset the data or store/load full workspaces. The tab Settings enables the configuration of the correlation analysis, the import formats or display language. The Export tab can be used to export the analysis in report format. Help displays information about the software.
- Calculate-Button - The Calculate button starts the correlation analysis for the selected data sets. The displayed results will stay constant until a new calculation is started.
- Loaded data sets - This area displays the loaded data sets. The first section shows all the non-destructive RSWA exports. Below, the mapping file is named and at the bottom the loaded destructive test reports. Each destructive test report must be associated with at least on non-destructive inspection from the RSWA. The associated inspection name is displayed next to it.
- Algorithmlist - Ranking Plot - The Ranking Plot is a visualization of the algorithm settings over the metrics Absolute Adjustment and Error Variance. It provides an overview over the quality of the different settings. By pressing the ctrl-key and left clicking the algorithm settings can be dragged into one of the correlation detail windows.
- Algorithmlist - Result List - The Ranking List displays all algorithm settings sorted by quality. The criteria used for sorting are elaborated on in Evaluation.
- RSWA Data - Group Filter - Group filters may be defined via the mapping file. This way, welds of a certain group may be filtered by more quickly.
- RSWA Data - Column Filters - The non-destructive data list contains all measurements that were exported from the RSWA and imported into the Correlator App. The column filters allow to filter the view on this data. In contrast to the group filters, these don't change the selection of welds for the correlation, only the amount shown in the list.
- RSWA Data - Datasets - All welds exported from the RSWA are shown here. Left clicking an entry selects/deselects it.
- Correlation Detail Windows - The three correlation detail windows plot the non-destructive measurement results against the destructive measurements for the selected algorithm settings. Additional statistical indicators are displayed below the plot as well as the option to export these settings to TDS.
There are tooltips for many of these elements that will be displayed if available, when the mouse is hovering still over an element.
Parsing of Data Sets
Before calculating a correlation analysis, the respective source data sets need to be generated and parsed. The Correlator App requires three sets of input data:
- non-destructive measurement data
- a mapping file
- destructive measurement data
The relation beween the data sets is depicted in the schematic below.
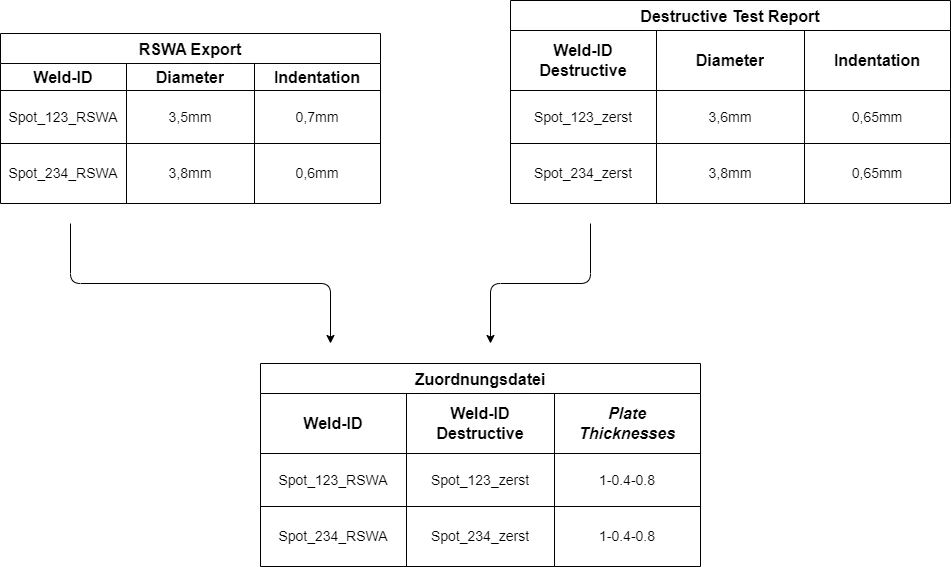
For performing the correlation it is necessary to map both destructive and non-destructive data sets. As weld IDs may be abbreviated or altered, a mapping is required to match both results. In the following section it will be described how these need to be structured.
RSWA Export
The inspections of a single part type can be selected for export on the RSWA. Assuming that there are multiple parts to be correlated, such as Fender and Underbody, one or multiple inspections of Fender may be selected and, after the export has finished, one or more inspectons of Underbody.

Note, this feature is only available in Export Selected Mode, not in Export Recommended. The button Select for Correlation creates a correlation export instead of an export to TDS. A dialog will open asking for a location to save the correlation export to. Now, this export may be moved from the device to a desktop machine via network shares, flash drive or by other means, where the correlation analysis will be run. The Correlator App can parse such data sets by clicking on File→Open RSWA Export.
Mapping File
The mapping file must be provided by the user. It's a CSV file that must contain two columns:
- ID of the spot weld in the RSWA export
- ID of the spot weld in the destructive test report
This way, the results from the destructive tests can be associated with one or multiple measurements in the non-destructive RSWA export. Should the destructive test reports happen to use the same identifiers as the non-destructive RSWA exports, both columns can be identical.
Additional optional columns that are relevant for the binary classification are
- the front plate thickness
- the middle plate thickness, if applicable
- the back plate thickness
The mapping CSV has to contain a header row. These headers should be unique to every column. Below the header row all data rows must be listed without empty rows.
The format of the mapping file may be configured by going to Settings→Configure CSV Imports. The opened configuration window contains multiple tabs. The tab Mapping File as well as General contain settings that are relevant for the mapping file.
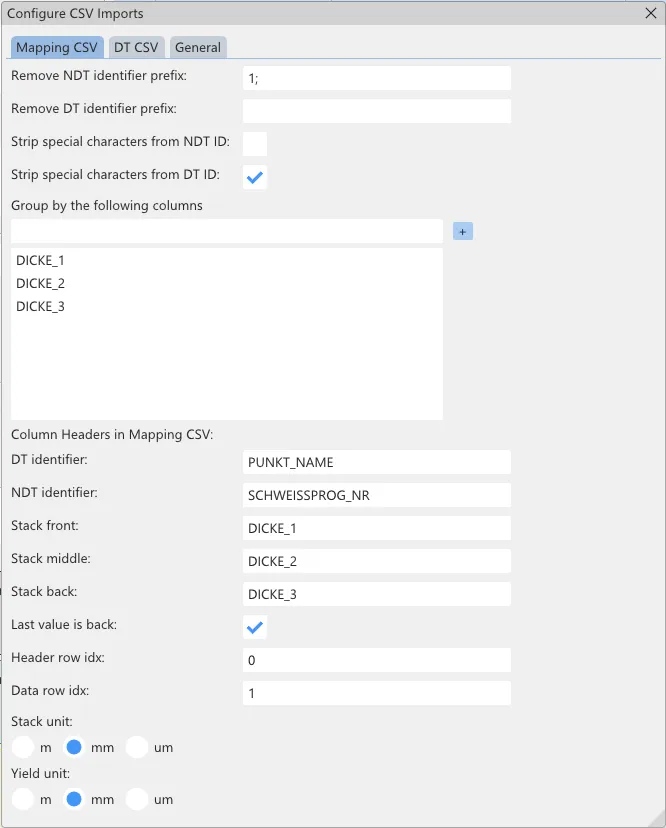
The shown settings are the ones provided by the shipped example workspace. The meaning of each setting is shown in form of a tooltip, when hovering over a setting.
- Remove NDT identifier prefix - Leading characters can be removed from the ID column for non-destructive results. This may be useful if the mapping file was generated automatically and there are minor differences between the actual reports and the mapping file. Example: "1;" results in: "1;123_spotweld"→"123_spotweld"
- Remove DT identifier prefix - Same as "Remove NDT identifier prefix" for the column of IDs of destructive measurements. Example: "Product_" results in: "Product_123_spotweld"→"123_spotweld"
- Strip special characters from NDT ID - Removes special characters (non-alphanumerical) from the ID column for non-destructive measurements. This may be useful if the mapping file was generated automatically and there are minor differences between the actual reports and the mapping file. Example: Activating it results in: "123_Spot;Weld"→"123SpotWeld"
- Strip special characters from DT ID - Same as "Strip special characters from NDT ID" for the column of IDs of destructive measurements. Example: Activating it results in: "123_Spot;Weld"→"123SpotWeld"
- Group by the following columns - Column headers listed here will be criteria for weld grouping. For example, enumerating the columns containing stack thicknesses allows using the group filter in the Correlator App to filter for specific stack combinations. Example: "Stack_1", "Stack_2", "Stack_3" results in: The columns Stack_1, Stack_2 and Stack_3 are used to group the welds according their individual stack thicknesses.
- DT identifier - The column header in the mapping file that contains the DT ID [REQUIRED]. Example: WELD_NAME results in: The column with header "WELD_NAME" will be interpreted as DT ID.
- NDT identifier - The column header in the mapping file that contains the NDT ID [REQUIRED]. Example: WELD_NAME results in: The column with header "WELD_NAME" will be interpreted as NDT ID.
- Stack front - The column header in the mapping file that contains the front plate thickness. Example: STACK_1 results in: The column with header "STACK_1" will be interpreted as the front plate thickness.
- Stack middle - The column header in the mapping file that contains the middle plate thickness. Example: STACK_2 results in: The column with header "STACK_2" will be interpreted as the middle plate thickness.
- Stack back - The column header in the mapping file that contains the back plate thickness. Example: STACK_3 results in: The column with header "STACK_3" will be interpreted as the back plate thickness.
- Last value is back - Activating this option toggles the last value as back side. This is only relevant for two plate combinations, as three plate welds are always interpreted as front-middle-back. Example: Activating this results in: 1-1-0 is a two plate combination with a thickness of 1 each. Deactivating this results in: 1-1-0 is a three plate combination with front and middle thickness of 1 each.
- Header row index - The row number (starting at 0) where the column headers are located. Example: 3 results in: In the 4th row the column headers are located.
- Data row index - The row number (starting at 0) at which the tabular data starts. Example: 5 results in: Starting from the 6th row the rows are interpreted as tabular data.
- Stack unit - The unit used in which stack thicknesses are given Example: m (meter) results in: A value of 0.0015 will be shown as 1.5mm.
Destructive Test Reports
The destructive test reports contain the welds' diameters, that have been measured destructively. They must be provided by the customer and loaded into the Correlator App in the form of CSV files.
They must at least contain the following columns:
- weld IDs
- nugget / spot diameters of plates 1 and 2
Additionally, the following columns may be useful as well:
- nugget / spot diameters of plates 2 and 3
The CSV of the destructive part measurement reports has to contain a header row. These headers should be unique to every column. Below the header row all data rows must be listed without empty rows.
In the Correlator App under Settings→Configure CSV Imports, there are options to configure the format of the mapping file. It opens a preferences window with multiple tabs. The tabs DT CSV and General contain settings that may be relevant for the import of destructive test reports.
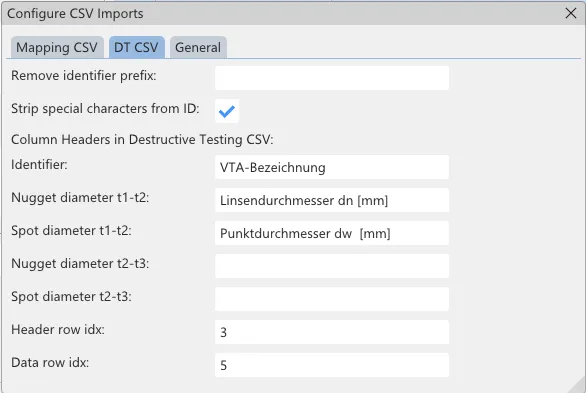
The shown settings are those that fit the shipped sample data set. The respective meaning of each setting can be seen by inspecting the tooltip that is shown when hovering over it. An overview is given by the following table.
- Remove identifier prefix - This removes leading characters from weld identifiers of destructive measurements. Example: "1;" results in: "1;1234_SW" → "1234_SW".
- Strip special characters from ID - This removes special (non-alphanumeric) characters from weld identifiers of destructive measurements. Example: Aktiv results in: "1;1234_SW" → "1234SW".
- Identifier - The column header of the data column that contains the DT weld identifier Example: "SPOT_NAME" results in: The column with header "SPOT_NAME" will be interpreted as DT ID.
- Nugget diameter t1-t2 - The column header of the data column that contains the nugget diameter between the plates 1 to 2 Example: "D_S_12" results in: The column with header "D_S_12" will be interpreted as the nugget diameter between the plates 1 to 2.
- Spot diameter t1-t2 - The column header of the data column that contains the spot diameter between the plates 1 to 2 Example: "D_N_12" results in: The column with header "D_N_12" will be interpreted as the spot diameter between the plates 1 to 2.
- Nugget diameter t2-t3 - The column header of the data column that contains the nugget diameter between the plates 2 to 3 Example: "D_S_23" results in: The column with header "D_S_23" will be interpreted as the nugget diameter between the plates 2 to 3.
- Spot diameter t2-t3 - The column header of the data column that contains the spot diameter between the plates 2 to 3 Example: "D_N_23" results in: The column with header "D_N_23" will be interpreted as the spot diameter between the plates 2 to 3.
- Header row index - Example: "3" results in: In row 4 the column headers can be found.
- Data row index - Example: "5" results in: In row 6 the table data start.
General CSV Settings

Via the "General" tab in the settings window (Settings→Configure CSV Imports) all CSV imports can be customized:
- Use decimal comma in CSV - Sets whether the Correlator App expects a comma instead of a dot as decimal separator as is custom in some countries. This affects the way numbers are interpreted. Example: Activation results in "1,23 being interpreted as the number 1.23. Inactive results in 1.23 being interpreted as 1.23.
- CSV column seperator - Sets which symbol is expected as the CSV column seperator. The checkbox to the right can be set to use tabs. Example: ";" results in the row "Good;Morning;1,23" being interpreted as Good | Morning | 1,23
Next Chapters
Visit here to learn about the different backup results, and here to learn about evaluation.