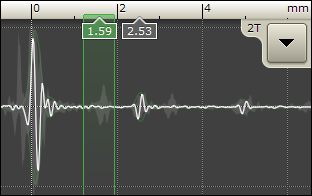
A-Scan Area
The A-Scan area shows waveforms (A-Scans) for the individual elements in the transducer's matrix.

You can choose which one out of the 52 matrix elements is displayed by making a selection in the C-scan area (see C-Scan Area).
White Curve - Shows the A-scan for the currently selected element.
Shadow in Background - Shows the composed A-scans from all the elements.
Number Boxes - Position of front-wall and back-wall reflections.
Green Vertical Lines - Gates showing the range for C-scan acquisition. These gates are set automatically when you press the Setup button. To adjust them manually, push and hold the touch screen inside the A-scan area.
Additional options are available through a drop down menu:
Display Mode - Used to change how a-scans are displayed. The default value is Bipolar.
Ruler Units - Used to change the units used for the a-scan ruler. The default is Depth.
3T Mid. Thickness - Used to set the thickness of the middle plate when performing 3T inspections. Make sure this to off when performing a 2T inspection.
Processed A-Scans - Use this option to see a-scans with signal processing (default).
Raw A-Scans - Use this option to see a-scans without signal processing.