Reports
TDS offers a variety of reporting tools to help get a better understanding of part failures and reasons for them.
Part Failure Reports
To view part failure reports, first head to the Product Overview report page. You may also access the page via the Reports dropdown in the navbar by clicking the Product Overview link listed there.
- 4.9.0 and Newer
- 4.8.3 and Older
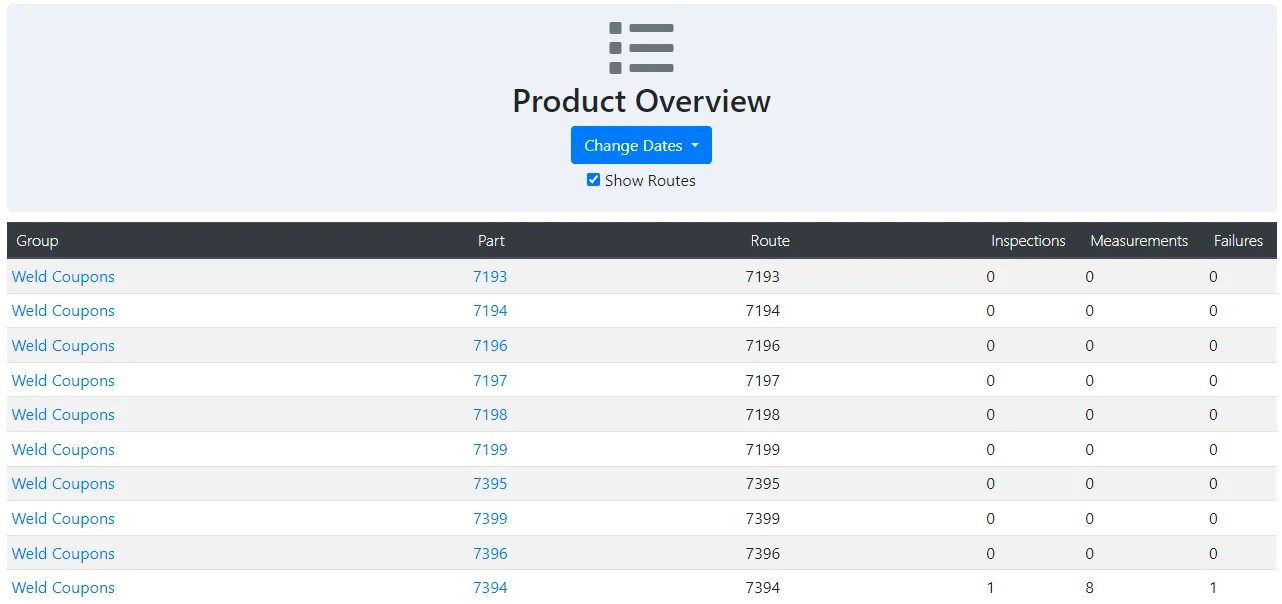
This page uses an accordion layout. Each group in the database can be expanded to show its subgroups and parts, and each part can be further expanded to display all its routes, each with their overall inspection statistics. The statistics include the total number of Inspections, Measurements, and Failures.
There is also an entry for all custom inspections performed on RSWA devices. For detailed information about a particular part or group, click the name in the leftmost column. You can use the Change Dates dropdown to adjust the displayed timespan. The Type dropdown lets you filter the list to display:
- Group - Only shows the groups without a dropdown.
- Part - Displays a list of all the parts without the accordion functionality. This is similar to the functionality of the Product Overview page for TDS versions 4.8.2 or older.
- Route - Displays a list of all the parts while allowing you to expand to see each part's routes.
- Custom Inspections - Simply displays the Custom Inspections row.
You can also filter by entering a name in the Search by Item Name field, which matches Groups, Parts, or Routes containing the specified text.
This page lists the overall inspection statistics for all Parts in every Group ever entered in the database. These statistics include the total number of Inspections, Measurements taken, and how many of them were Failures. The first entry will always be for custom inspections made on the RSWA. Due to the nature of these types of inspections, no further data can be provided. The Change Dates dropdown may be used to display a specific timespan. To view the details for an individual group, click the group's name in the leftmost column.
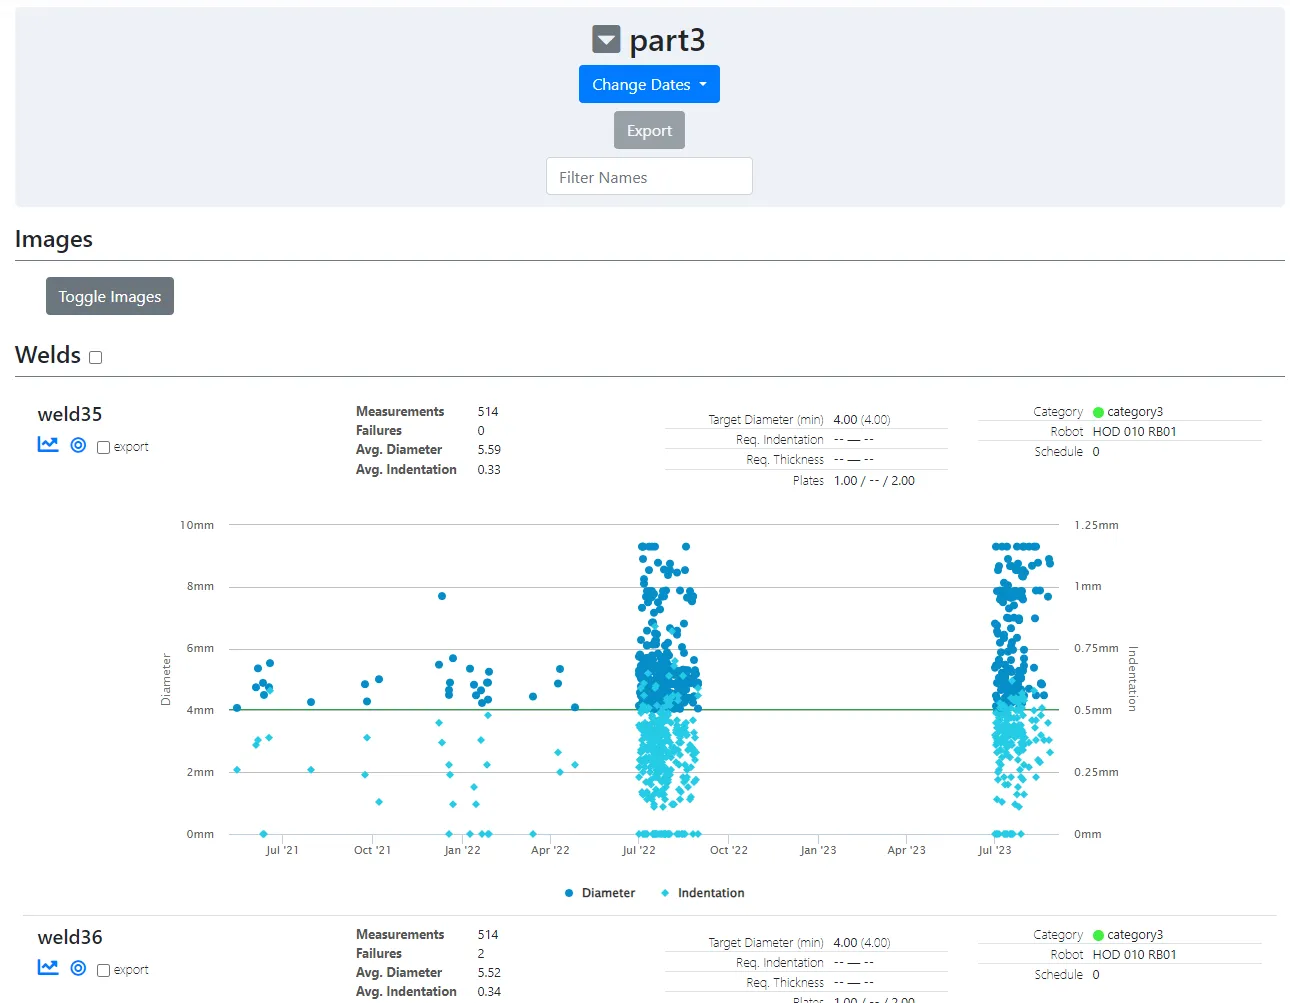
When a part name is clicked, the details page for that part is opened. This is very similar to the inspection details page for an inspection of that part. You may use the Filter Names dialog to show only a subset of the joints in the part. As before, the Change Dates dropdown may be used to select a specific timespan. For each individual joint, next to the image viewer icon, there is a report graph icon. Clicking this loads a graph plotting the data for each measurement made in the given timespan. Additionally, the part's template parameters are given as well as the measurement and failure statistics.
Reason Usage Report
To view decision reason reports, first head to the Reason Usage report page. You may also access the page via the Reports dropdown in the navbar by clicking the Reason Usage link listed there.
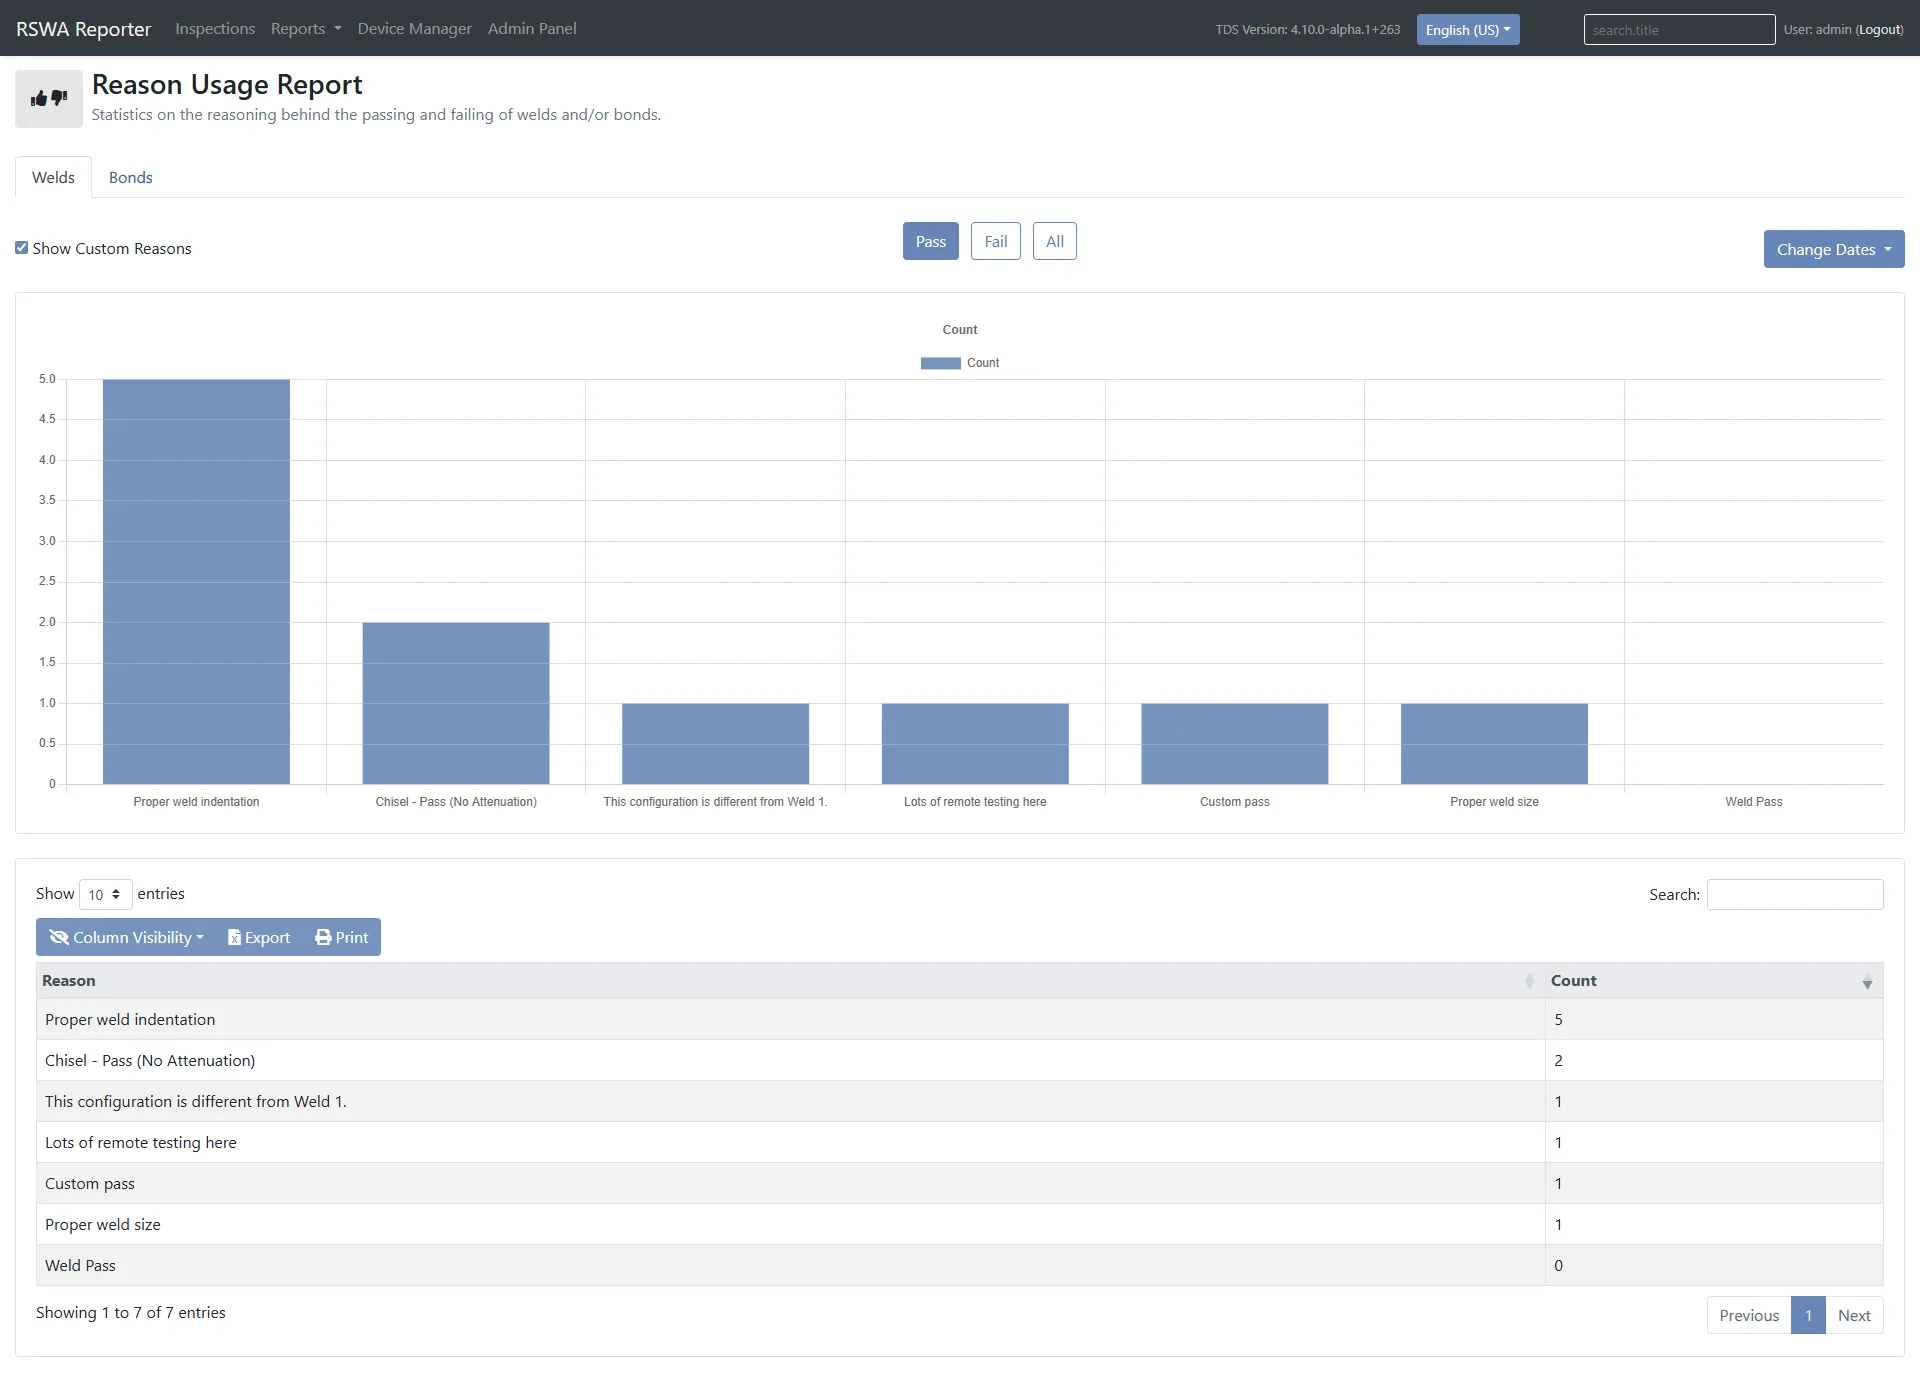
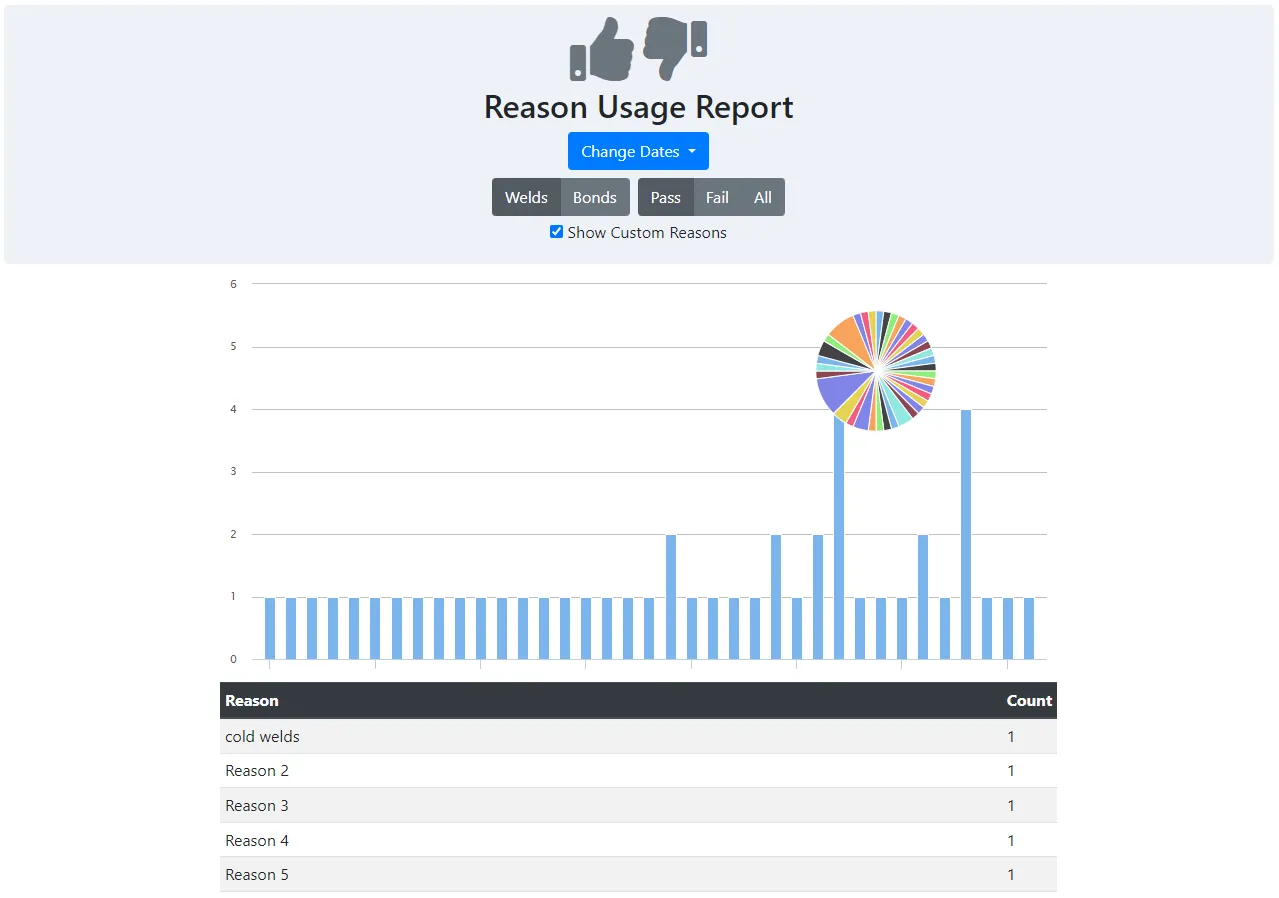
This page lists reasons for passing or failing a given measurement during an inspection. At the top of the page, you will see filter options for modifying the results. You may change the given date range, switch between viewing the reasons for Welds and Bonds or viewing Pass and Fail reasons, or both via the All option.
The Show Custom Reasons checkbox will change how reasons entered at inspection time by the operator are displayed. If unchecked, they will be grouped together under the "Other Pass" entry. Otherwise, there will be an entry for each unique instance.
A bar graph displays the counts for each reason based on the selected filters. Below the graph, you can view the precise count for every reason. Reasons that have been deleted from the data server will appear as ** Deleted Pass or ** Deleted Fail.
- 4.6.0 and Newer
- 4.5.1 and Older
For TDS versions 4.6.0 and newer, you have the option to export the table of reasons as a CSV file or print the document.
There is also a pie chart visualizing the proportion each reason is used throughout all measurements. Hovering over one segment of the chart will show the corresponding reason.
User Usage Report
To view the work by various users, first head to the User Usage report page. You may also access the page via the Reports dropdown in the navbar by clicking the User Usage link listed there.
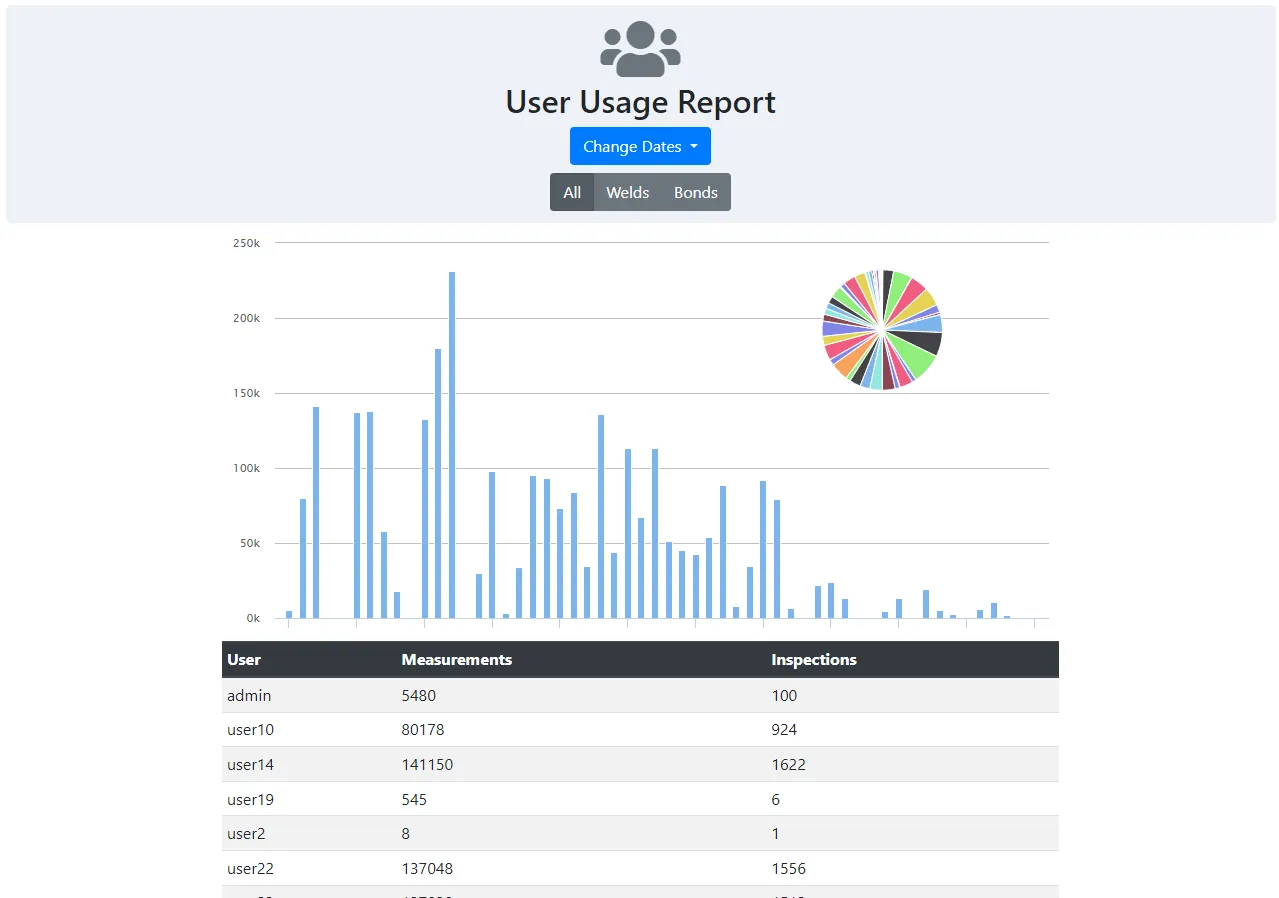
This page lists the number of inspections and measurements performed by all the different users. At the top of the page, you will see filter options for modifying the results. You may change the given date range, switch between viewing the report for Welds and Bonds, or both via the All option. For TDS versions 4.8.0 and newer, you can also hide deactivated users from the statistics.
A bar graph displays the number of measurements and inspections performed by each user matching the selected filters. Below the graph, the entry list provides detailed information for each user in the data server.
- 4.6.0 and Newer
- 4.5.1 and Older
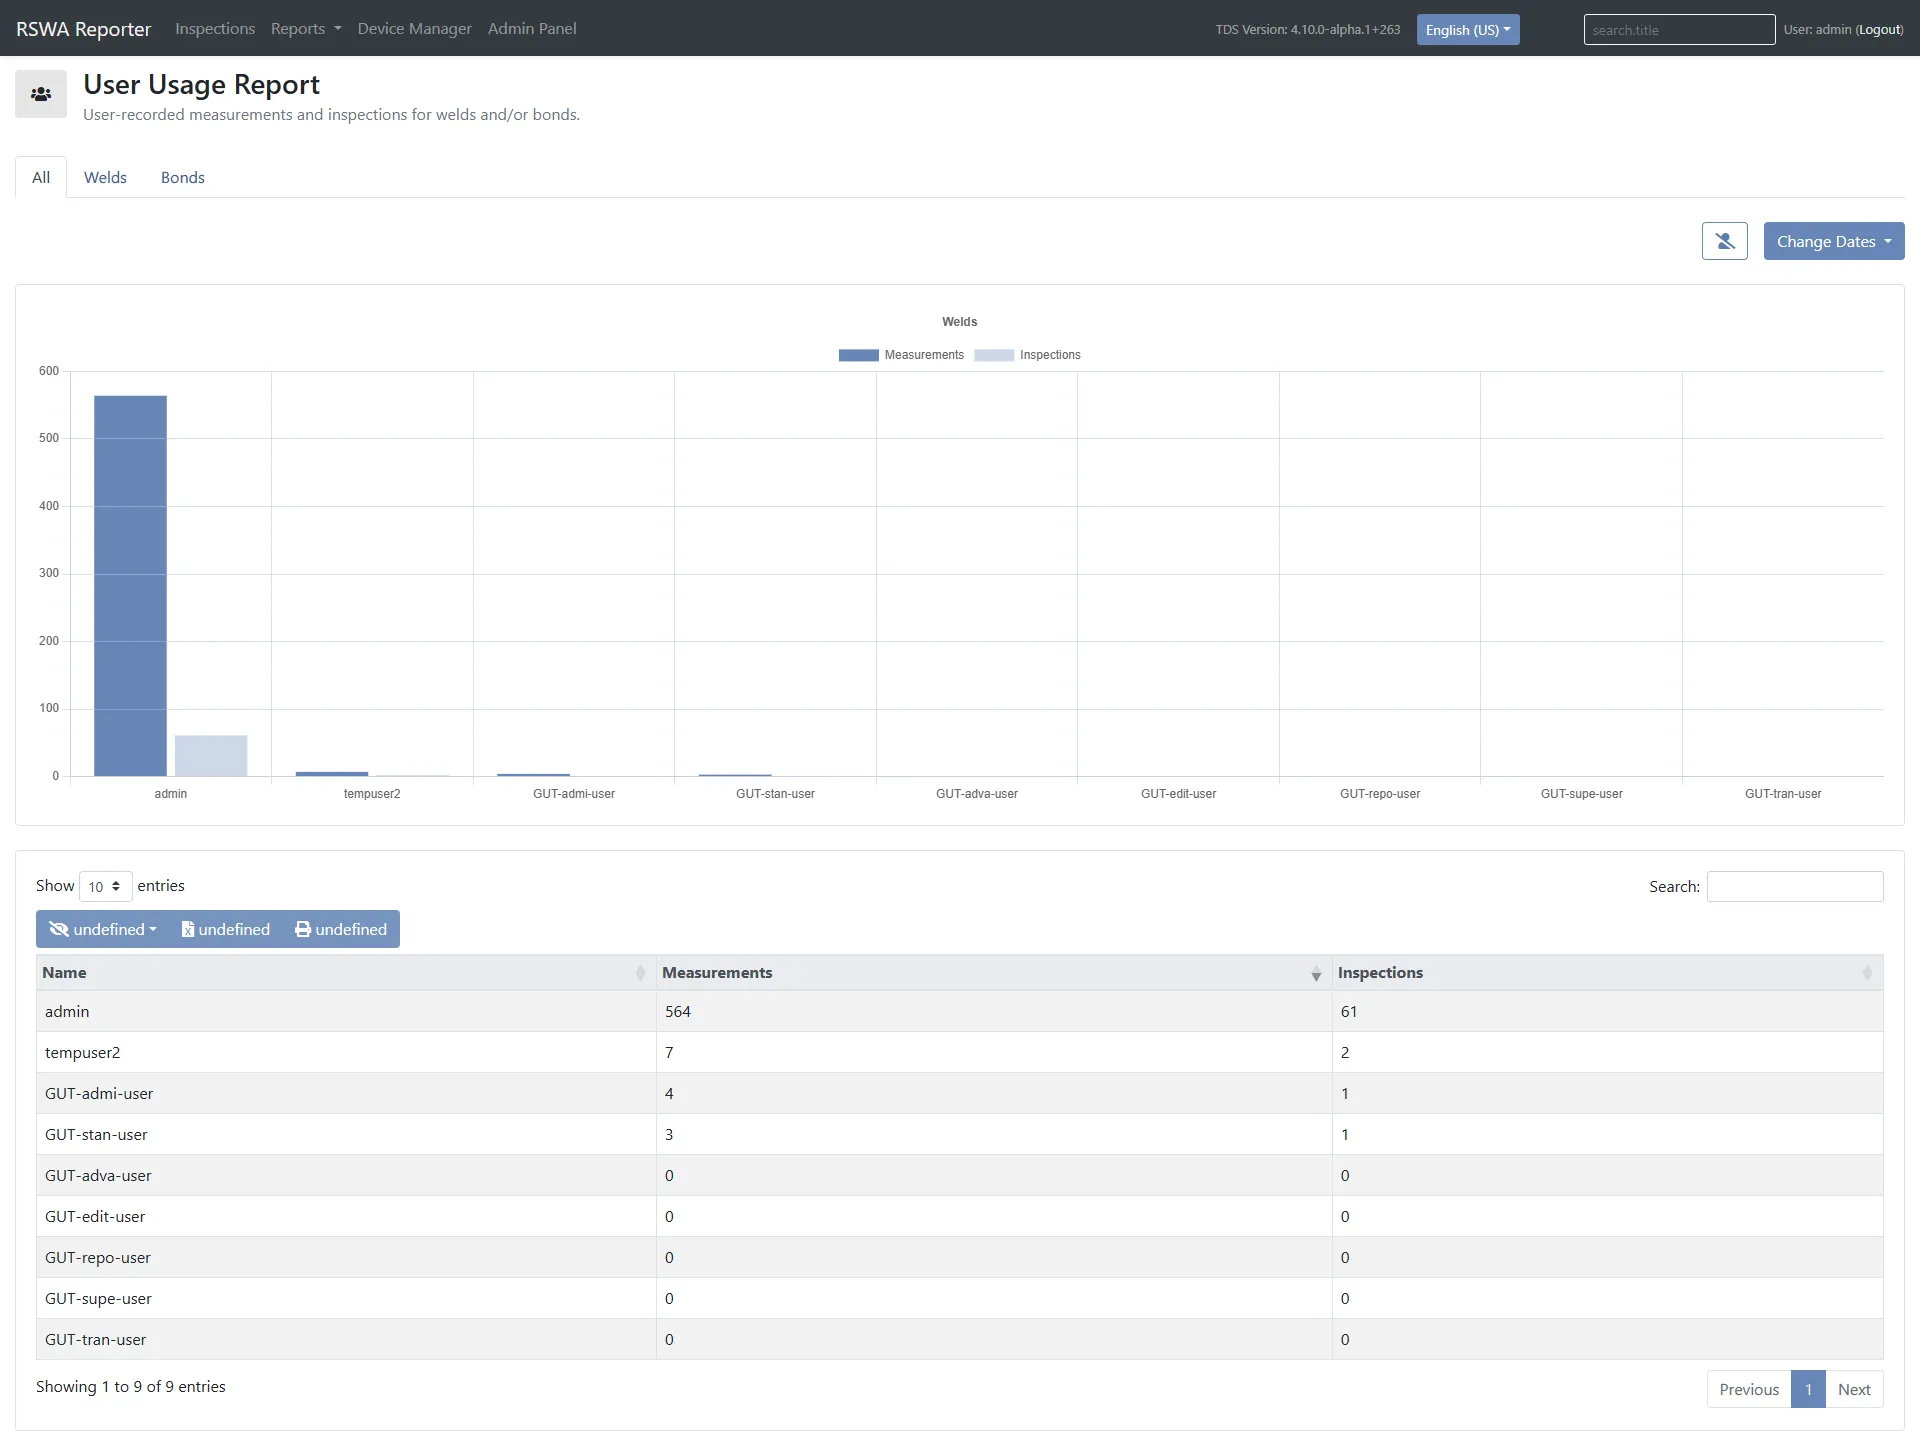
There is also a pie chart visualizing the proportions of inspections performed by each user. Hovering over one segment of the chart will show the corresponding user.