Weld Summary
Overview
Please refer to this documentation to navigate the weld summary report that is generated when you click on the colored square representing a weld.
Layout
- Red indicates a bad weld
- Yellow indicates an acceptable weld
- Green indicates a good weld
- White indicates no weld was imaged
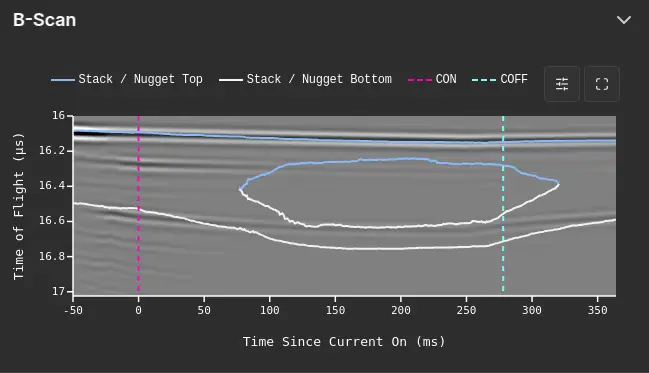
B-Scan
The B-Scan provides a comprehensive image of the weld annotated by the AI. It outlines the current-on and current-off cycles, as well as the nugget, showing both the top and bottom sheets.
Hall Effect
The Hall Effect chart provides a graph of when the current-on and current-off cycles occurred. Additionally, it offers extra data such as the x, y, z, and magnitude, which correlate to the status of the current.

Stack
The Stack chart provides data on the sheets, including the sheet number, thickness, and material.

Quality Metrics
The Quality Metrics chart provides data related to the weld, including the penetration and time above threshold for both the top and bottom sheets.

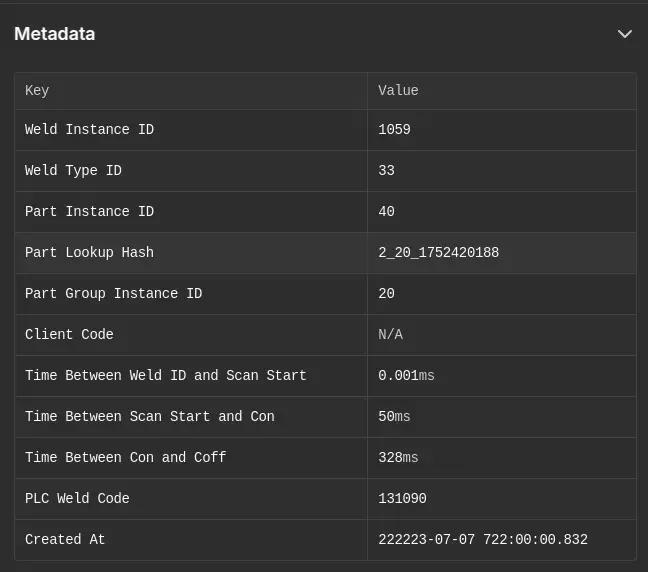
Metadata
The Metadata section includes useful miscellaneous data about the weld.